Classification
Forecasting
Impact of Olympics on Air Quality in Beijing
This sample application is intended to show usage of the Nexosis API using the .NET client library. If you are following along, you will be able to to analyze data provided by the U.S. Department of State of the historical PM2.5 levels in Beijing1. You can learn more about PM2.5 from the EPA.
Getting Started
In order to run the code associated with this sample, you must first create an account. The sample code is hosted on GitHub and can be cloned and run locally.
Setup
The first two steps to run this analysis do not use the Nexosis API, but are used to set up the data to be used by the API. The historical air quality data is provided by the State Department in downloadable CSV files. These have been copied into the Git repository for your convenience. To import the data, you can use the following command:
> dotnet run AirQuality --import --database=aqi.sqlite3 --files=*.csv
This will save the values from the CSV files into the database specified by the command. Once this has completed, the data will be staged
in an import table in the database. The next step is to process the imported values into the data that will be submitted to the Nexosis API.
At this point, imputation is not performed as part of the analysis in the API, and missing values will cause problems when
doing predictions. Since this data has missing values,
the average of the dataset (93) was used as a constant value for each hour missing in the original dataset. You will need to determine the best
strategy given your data. In the sample, this step can be run with the following command:
> dotnet run AirQuality --preprocess --database=aqi.sqlite3
The source data is now cleaned-up and saved to the measurements table and is ready to be used.
Using the API
Uploading Data
To start using the API with .NET you need to add the NuGet package. Once installed, you can create an instance of the
client and start to explore the API. If you have already set an environment variable named NEXOSIS_API_CLIENT to one of your API
keys from your account, then it is as simple as instantiating a new instance of the client as you can see in the following examples.
Once a client object has been created, you can begin to use the API by uploading the data you wish to use for analysis. When saving data to the API, you need to make sure that your request size falls within the limits allowed. In order to do this, you can batch the data as shown in the following code:
var api = new NexosisClient();

var measurements = LoadMeasurements(db, startDate, endDate, source, interval);
var batchSize = 5000;

// there is a limit on request size so we batch the data that is to be uploaded
for (int i = 0; i < ((measurements.Count / batchSize) + 1); i++)
{
    var ds = await api.DataSets.Create(DataSet.From(
        dataSetName,
        new DataSetDetail { Columns = columns, Data = measurements.Skip(i * batchSize).Take(batchSize).ToList() }
    ));
    Console.Out.WriteLine($"Added to dataset named {ds.DataSetName}. Cost: ${ds.Cost.Amount}.");
}
In this case, the API has inferred which column is the timestamp and which contains the target value to analyze. If necessary, you can specify that information when you send the data. This is also how you would include columns to be used as features when performing an analysis.
The sample application allows you to upload the data giving it a name, and optionally filtering the data to only include certain dates. For this example you should use June, July and August of 2008.
> dotnet run AirQuality --upload --database=aqi.sqlite3 --dataset=beijing-pm25-jun-aug \
  --start="2008-06-01 00:00 +8:00" --end="2008-08-31 23:00 +8:00" --interval=hour
This command uploads the data stored in the database naming the dataset “beijing-pm25-jun-aug”, between the dates specified, storing the data on an hourly interval level.
Impact Analysis
When you want to look at the effect of an outside influence on your data, you can do impact analysis. In this example, you can look at how the PM2.5 changed during the 2008 Summer Olympic Games hosted in Beijing. At the time, it was widely reported that athletes were concerned about the air quality and how it might hurt their performance or have long term negative effects. China responded by curbing pollution-causing activites. Using the Nexosis API, you can show what the PM2.5 values would have been, and how much impact the changes enacted helped to control the harmful pollution in the air.
You can create a session to analyze impact with just one line of code.
var api = new NexosisClient();

// given the name of the dataset, the 'column' of the data to predict on and the date range, it is easy to start it.
var impactSession = await api.Sessions.AnalyzeImpact(
    Sessions.Impact(dataSetName, startDate, endDate, ResultInterval.Hour, impactName, "value")
);

using (var db = OpenDatabase(database))
{
    SetupSessionResults(db);
    AddSessionRecord(db, impactSession.SessionId, $"{dataSetName}.{impactName}", impactSession.RequestedDate);
}
You can run the above code with the following command to specify the type of session to create and the parameters for it.
dotnet run AirQuality --impact --name="olympics-impact" --database=aqi.sqlite3 \
    --dataset=beijing-pm25-jun-aug daily -s="2008-08-08 00:00 +8:00" -e="2008-08-24 23:00 +8:00" --interval=hour
Running that command will tell you that a job has been started and also give you the cost:
Analyzing impact of event olympics-impact on dates 2008-08-08T00:00:00.0000000+08:00 to 2008-08-24T23:00:00.0000000+08:00
Analyzing hourly impact on beijing-pm25-jun-aug data from 2008-08-08T00:00:00.0000000+08:00 to 2008-08-24T23:00:00.0000000+08:00 costing $1.70. Session id: 015d31bb-b5f7-490d-8c72-e3e4bf29c9ab
You will get an email when this process has completed, and you can then query for the results and perform your analysis.
Getting Results
The following code shows an example of how you can get results from the API. The session has to be completed before this can be done, so there is test for that first. The rest of this code block saves the results to the local database for further analysis.
var api = new NexosisClient();

var results = await api.Sessions.GetResults(sessionId);

// only save results if we actually have them
if (results.Status != Status.Completed)
{
    Console.Out.WriteLine($"Unable to get results from session in {results.Status} state.");
    return;
}

// save results
using (var db = OpenDatabase(database))
{
    // if there is more information about the session to save, then do it
    UpdateSession(sessionId, db, results);

    using (var tran = db.BeginTransaction())
    {
        // iterate the items inserting them in the session_results table
        foreach (var item in results.Data)
        {
            AddResult(sessionId, db, results, item);
        }
        tran.Commit();
    }

    db.Close();
}
To run this code and save the results to the local database, you can run the following command:
dotnet run AirQuality --results --database=aqi.sqlite3 -id="015d31bb-b5f7-490d-8c72-e3e4bf29c9ab"
Note that the session ID given in the command line is also the the ID reported in the output of creating the session.
Analysis
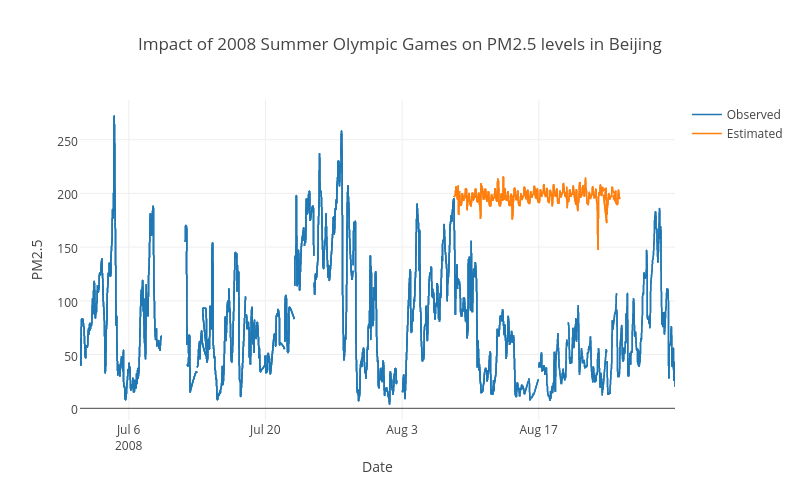
When looking at the air quality data on an hourly basis, the results were reasonable, but not great. Impact analysis gives you some extra data that is important for qualifying the accuracy of the analysis. The p-value indicates the accuracy of the results. The resulting p-value of the hourly impact analysis was 0.24. This is a middling p-value at best. The following graph shows the results of this run, where you can see the line looks a bit too high on the y-axis.

pValue:         0.2422
absoluteEffect: -55610.481
relativeEffect: -0.7151
You can get the results from the database to graph them with the following SQL, substituting for the source and session ID columns as appropriate.
SELECT
    m.timestamp,
    m.value AS observed,
    p.value AS predicted
FROM
    measurements m
    LEFT JOIN session_results p
        ON date(m.timestamp) = date(p.timestamp)
WHERE
    m.timestamp BETWEEN '2008-06-01' AND '2008-08-31'
    AND
    m.interval = 'd'
    AND
    m.source = 'computed'
    AND
    (p.session_id = '015d31bbb5f7490d8c71e3e5bf29c6ab' OR p.session_id IS NULL)
Analysis (again)
At this point there are a few options - the first one is to change the input into the analysis. Averaging the hourly observations into daily values will decrease the number of data points available, but may give cleaner results. You can run the following SQL on the saved data and save the average value of PM2.5 for each day.
INSERT INTO
    measurements
SELECT
    NULL, date(timestamp), avg(value), 'computed', 'd'
FROM
    measurements
GROUP BY
    date(timestamp);
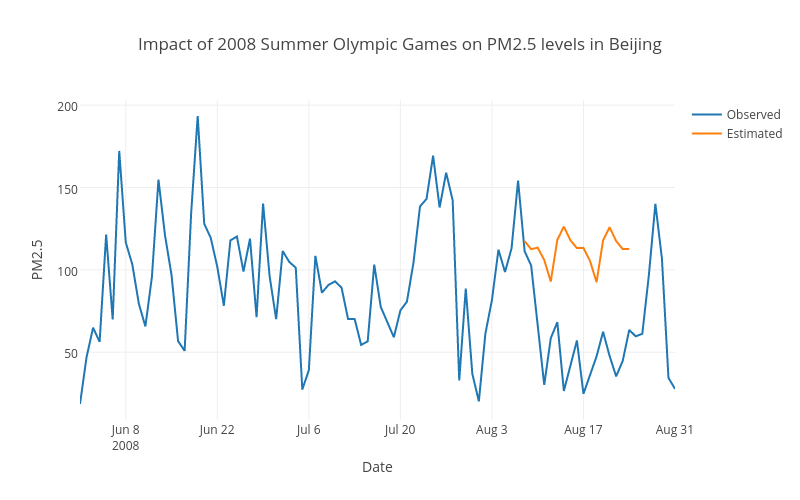
Once you have averaged values you can repeat the steps above, substituting some different values as the arguments for the analysis and end up with a new result that has calculated the impact based on the daily average. Looking at the p-value for this analysis, you can see that it is a much more reliable.

pValue:         0.0515
absoluteEffect: -992.7356
relativeEffect: -0.5182
Looking at the graph and the metrics coming out the analysis, you can be confident that during the 2008 Summer Olympic Games the air quality in Beijing was roughly 50% better than in the preceding months. To take this analysis further, you could start to include features such as temperature and precipitation during that period as those both have an effect on the PM2.5 value.
1: In accordance with the data use policy given by the U.S. Department of State, the data used in this analysis is not fully verified or validated; these data are subject to change, error, AND CORRECTION. the data and information are in no way official.
