Classification
Forecasting
Marketing Impact on Facebook Page Likes
This simple tutorial will illustrate how to use Impact Analysis in the Nexosis API to measure the impact of marketing changes on Facebook likes over a period of time using data from Facebook. This tutorial uses the Nexosis Java client library.
You can follow along using the full source code in github.
Source Data
Here’s a snippet of the CSV data showing a series of metrics from Facebook:
date, page_views, amount_spent, total_page_likes, daily_paid_likes, daily_organic_likes, paid_post_impressions, organic_post_impressions
1/1/2016, 0, $0.00, 30, 0, 0, 0, 0
1/2/2016, 1, $0.00, 30, 0, 0, 0, 1
1/3/2016, 0, $0.00, 30, 0, 0, 0, 0
1/4/2016, 1, $0.00, 30, 0, 0, 0, 1
1/5/2016, 0, $0.00, 30, 0, 0, 0, 0
1/6/2016, 1, $0.00, 30, 0, 0, 0, 1
1/7/2016, 0, $0.00, 30, 0, 0, 0, 0
1/8/2016, 1, $0.00, 30, 0, 0, 0, 1
1/9/2016, 3, $0.00, 30, 0, 0, 0, 1
1/10/2016, 0, $0.00, 30, 0, 0, 0, 0
1/11/2016, 1, $0.00, 30, 0, 0, 0, 2
...{snip}...
6/16/2017, 13, $167.14, 1226, 27, 1, 11415, 54
6/17/2017, 17, $164.44, 1249, 20, 3, 10215, 13
6/18/2017, 14, $161.71, 1273, 22, 2, 10215, 13
6/19/2017, 12, $156.38, 1297, 24, 0, 11388, 40
6/20/2017, 14, $115.78, 1316, 18, 1, 9155, 227
6/21/2017, 15, $117.80, 1335, 17, 3, 6039, 375
6/22/2017, 17, $107.72, 1355, 19, 1, 7430, 251
6/23/2017, 12, $118.38, 1388, 33, 1, 7468, 239
6/24/2017, 8, $97.66, 1403, 16, 1, 6862, 160
6/25/2017, 9, $108.15, 1423, 19, 2, 6290, 127
6/26/2017, 6, $109.63, 1438, 14, 2, 7989, 71
6/27/2017, 10, $108.16, 1459, 20, 1, 6605, 65
6/28/2017, 4, $32.04, 1466, 6, 0, 2900, 32
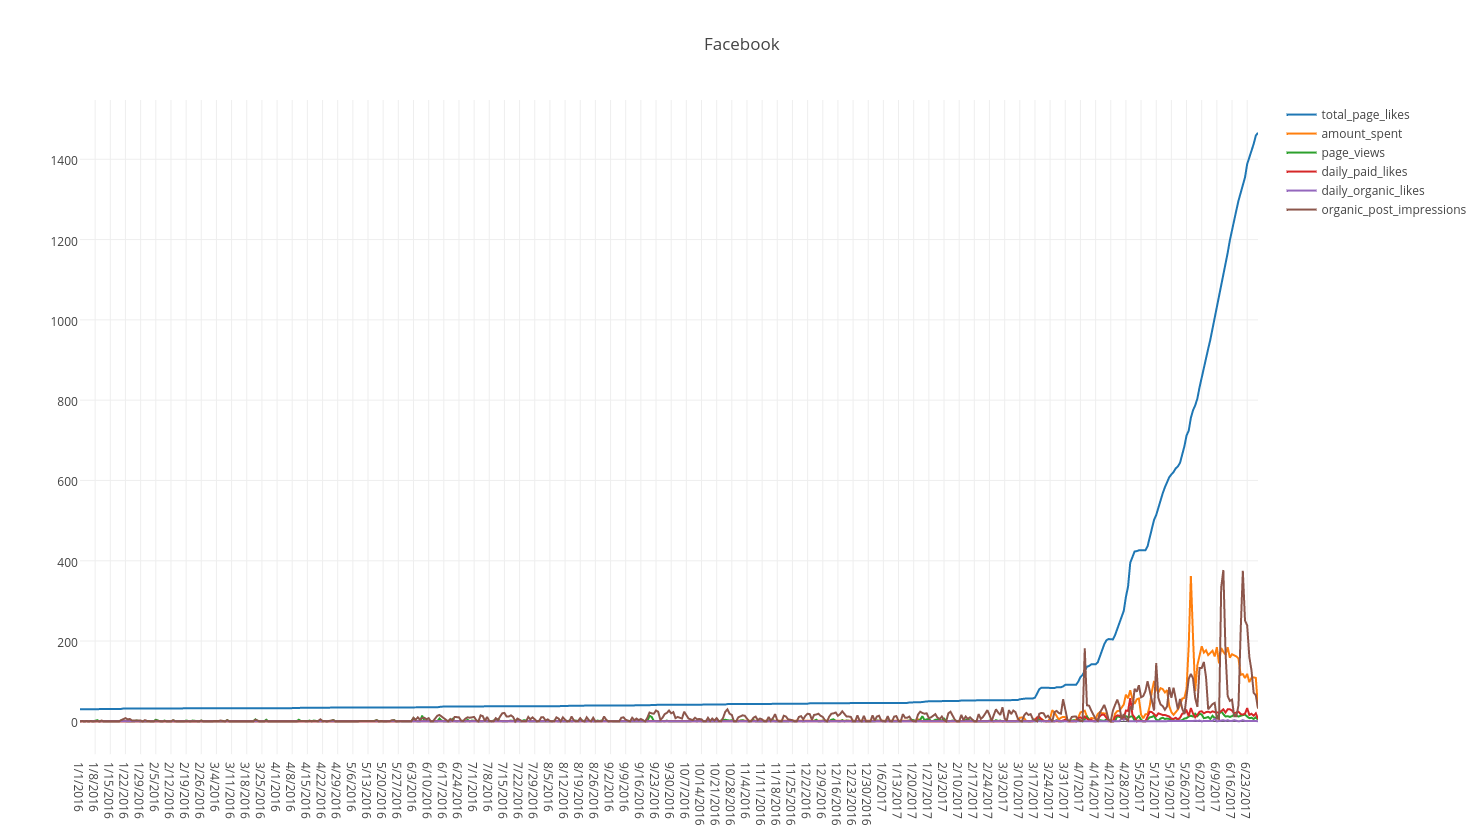
The graph below shows the data starts on 1/1/2016 and ends on 6/28/2017. By visually inspecting the data it’s clear that Page Likes are pretty stagnant for just over a year. Starting around 3/15/2017 there is a small but very clear acceleration of Page Likes and then a considerable change in the slope around 4/6/2017. The initial boost correlates with when the new marketing campaign kick-off occurred.
We’ll measure the impact of the new Facebook marketing push over that time period starting on 3/15/2017 through the end of the data stream, 6/28/2017.

Loading the Facebook Data
The first step is to submit the data to the Nexosis API. Here’s a simple method to illustrate how to parse data from the CSV using the Java Client Library and create a dataset on the server.
By giving the dataset a name, it can be referenced later allowing you to add or modify data to it, create a forecast, or perform impact analysis on a period of time.
In this sample, instead of submitting the raw CSV file stream to the API, it gets parsed into a DataSetData object and that gets submitted by the Java Client serialized as JSON.
After the CSV is loaded into the DataSetData object, the create() method is called passing in the dataset name as well as the object containing the data.
 private static void loadDataSet(NexosisClient client, String dataSetName, String fileName)
                                                            throws IOException, NexosisClientException {
    // Load the CSV into a DataSet object
    DataSetData loadedDataSet = loadDataSetFile(fileName);
    // Create the dataset on the server
    client.getDataSets().create(dataSetName, loadedDataSet);
}
To list all the datasets including the one just created above, call the client.getDataSets().list() method.
DataSetList dataSets = client.getDataSets().list();
System.out.println("Number of datasets: " + dataSets.getItems().size());
for (DataSetSummary data : dataSets.getItems()) {
    System.out.println("Name: " + data.getDataSetName());
}
Once the data has been submitted we can use the dates of interest to see how the marketing campaign did.
Creating an Impact Session
Once the dataset has been created, a session can be created that operates on that dataset. To create a session, it is helpful to change, or tune the metadata that is used to inform the algorithms what the data means.
The Columns object is used to create a data dictionary to specify things like data types (numeric, dates, categorical), notate the impact or forecast target column, and specify one or more Feature columns. A Feature column is a column that has a relationship with the Target column. That relationship may be very important in helping the algorithms build a model that has a higher predictive power.
Setting
Columnsmetadata is optional and Nexosis API will make its best guess if it isn’t provided. If you need more control over which columns are features or not, you should send in theColumnsmetadata.
We indicate that the "date" column is of type DataType.DATE and that it has a role of DataRole.TIMESTAMP. When using Time Series forecasting algorithms you must have one timestamp column in the dataset for it to work.
If you have data to submit that may be important later, or you’re just not sure if it is a good candidate to be a DateRole.FEATURE, set it to DataRole.NONE - you can always change it later if you want to use it as a feature.
  private static UUID runImpactAnalysis(NexosisClient client, String dataSetName, String eventName) throws NexosisClientException {
    // Change metadata for Impact analysis
    SessionData sessionData = new SessionData();
    sessionData.setDataSetName(dataSetName);

    Columns columns = new Columns();
    columns.setColumnMetadata("date", DataType.DATE, DataRole.TIMESTAMP);
    columns.setColumnMetadata("page_views", DataType.NUMERIC, DataRole.FEATURE);
    columns.setColumnMetadata("daily_paid_likes", DataType.NUMERIC, DataRole.NONE);
    columns.setColumnMetadata("paid_post_impressions", DataType.NUMERIC, DataRole.NONE);
    columns.setColumnMetadata("organic_post_impressions", DataType.NUMERIC, DataRole.NONE);
    columns.setColumnMetadata("total_page_likes", DataType.NUMERIC, DataRole.TARGET);
    columns.setColumnMetadata("daily_organic_likes", DataType.NUMERIC, DataRole.NONE);
    columns.setColumnMetadata("amount_spent", DataType.NUMERIC, DataRole.FEATURE);
    sessionData.setColumns(columns);

    SessionResponse response = client.getSessions().analyzeImpact(
            sessionData,
            eventName,
            DateTime.parse("2017-03-15T00:00:00Z"),
            DateTime.parse("2017-06-28T00:00:00Z"),
            ResultInterval.DAY
    );

    return response.getSessionId();
}
Create a session by calling getSession().analyzeImpact() - specify the dataset name to use, an event name so you know what impact you were attempting to measure, the Columns metadata, and start and end dates of the intervention (impact) period, and finally the ResultInterval.DAY to indicate that this is a daily forecast.
All Nexosis API Sessions return a GUID. This is the unique ID of the Session so it can be referenced later. Now the session has been created.
Converting a CSV to a DataSetData Object
While not completely necessary, as we can directly submit a CSV to the Nexosis API, it’s important to illustrate how to take some data source and convert it to a DataSetData object. The DataSetData object is a simple data structure containing rows and cells.
An additional item of interest is pointing out adding metadata Columns object as shown in Lines 21-30 below along with the dataset. These help define the data types and roles for the data. For now, the data types are set to appropriate values, and the Data role of TIMESTAMP column is indicated, which is important for time series data.
private static DataSetData loadDataSetFile(String fileName) throws IOException {
    File file = new File(fileName);
    LineIterator it = FileUtils.lineIterator(file, "UTF-8");
    DataSetData data = new DataSetData();

    try {
        List<Map<String, String>> rows = new ArrayList<>();
        String[] headers = null;

        while (it.hasNext()) {
            Map<String, String> row = new HashMap<>();
            String line = it.nextLine();
            // split csv row into a string array
            String[] cells = line.split(",(?=([^\"]*\"[^\"]*\")*[^\"]*$)");

            if (headers == null) {
                headers = new String[cells.length];
                System.arraycopy(cells, 0, headers, 0, cells.length);

                // Setup Default Columns MetaData
                Columns metadata = new Columns();
                metadata.setColumnMetadata("date", DataType.DATE, DataRole.TIMESTAMP);
                metadata.setColumnMetadata("page_views", DataType.NUMERIC, DataRole.NONE);
                metadata.setColumnMetadata("daily_paid_likes", DataType.NUMERIC, DataRole.NONE);
                metadata.setColumnMetadata("paid_post_impressions", DataType.NUMERIC, DataRole.NONE);
                metadata.setColumnMetadata("organic_post_impressions", DataType.NUMERIC, DataRole.NONE);
                metadata.setColumnMetadata("total_page_likes", DataType.NUMERIC, DataRole.NONE);
                metadata.setColumnMetadata("daily_organic_likes", DataType.NUMERIC, DataRole.NONE);
                metadata.setColumnMetadata("amount_spent", DataType.NUMERIC, DataRole.NONE);
                data.setColumns(metadata);
            } else {
                for (int i = 0; i < headers.length; i++) {
                    // Hack to remove dollar symbol from data.
                    if (i == 0) {
                        DateTimeFormatter formatter = DateTimeFormat.forPattern("MM/dd/yyyy");
                        cells[i] = formatter.parseDateTime(cells[i]).toString();
                    }
                    cells[i] = cells[i].replaceAll("\\$","");
                    row.put(headers[i].toLowerCase().replace(' ', '_'), cells[i]);
                }
                rows.add(row);
            }
        }
        data.setData(rows);
    } finally {
        it.close();
    }
    return data;
}
Waiting for Session Results
To retrieve results, you must wait until the session is completed. Check session status in Line 8 below using the getStatus() method and specify the sessionID GUID for the session you want to check on. When it’s completed, its status will be changed to SessionStatus.COMPLETED assuming the session is concluded successfully.
  private static void waitForSessionCompleation(NexosisClient client, UUID sessionID)
                                                throws NexosisClientException, InterruptedException {
        boolean keepWaiting = true;
        System.out.print("Waiting for job to complete");

        while (keepWaiting) {
            System.out.print(".");
            SessionResultStatus results = client.getSessions().getStatus(sessionID);

            switch(results.getStatus()) {
                case COMPLETED:
                case CANCELLED:
                    keepWaiting = false;
                    break;
                default:
                    keepWaiting = true;
                    break;
            }

            if (!keepWaiting)
                break;

            Thread.sleep(5000);
        }
        System.out.println("");
        System.out.println("Done.");
    }
Impact Results
Finally, once the results are ready you can retrieve the results via the sessionID. In this sample, it will write the results as a CSV to a file stream. To retrieve results, shown in Line 13 using getResults() method on the session, using the sessionID.
 private static SessionResult getImpactResults(NexosisClient client, UUID sessionID, String resultsFile) throws IOException, NexosisClientException {
        // Write output to file.
        File writeFile = new File(resultsFile);
        writeFile.createNewFile();

        OutputStream outputStream = new FileOutputStream(resultsFile);
        ReturnsStatus analysisResult = client.getSessions().getResults(sessionID, outputStream);
        System.out.println("Results written to " + resultsFile);
        System.out.println(analysisResult.getSessionStatus());
        outputStream.flush();
        outputStream.close();
        // Retrieve Session Results
        SessionResult result = client.getSessions().getResults(sessionID);
        return result;
    }
Once the results have been written to a file stream, you can query and request the metrics.
SessionResult result = getImpactResults(client, sessionID, resultsFile);

// Print out the metrics
for (Map.Entry<String, Double> entry : result.getMetrics().getAdditionalProperties().entrySet()) {
    System.out.println(entry.getKey() + ": " + entry.getValue());
}
To see how successful our results are, we want to review the pValue.
The pValue indicates if the results are of statistical significance. pValues range from
0.5down to0,0.5being essentially of no statistical significance and approaching0, of strong statistical significance.
The results for our Impact analysis show a pValue of 2.0E-4, or very close to 0. This indicates there was a strong statistical significance.
pValue: 2.0E-4
absoluteEffect: 49847.6007
relativeEffect: 8.3296
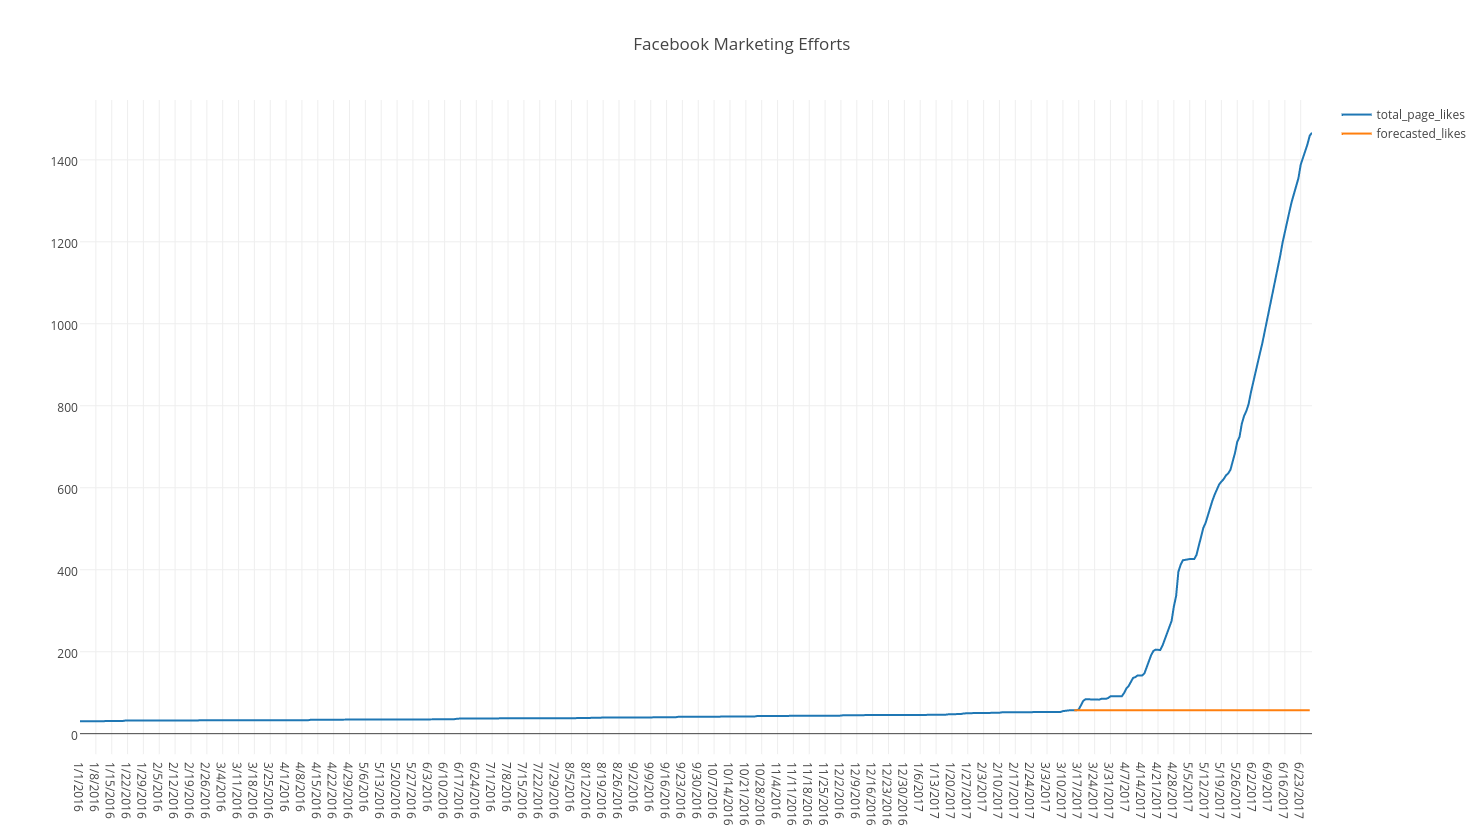
Relative effect is showing an effect of a ~833% increase. The absolute effect is showing the area under the curve in the chart below that’s between the orange and blue line during the impact period.
Here’s a plot showing a forecast of what likely would have happened (orange) had we not changed our marketing approach vs. what actually did happen.

