Classification
Forecasting
The Titanic - ML Beginner Course (101)
Understanding the survivability on the Titanic is a common way to get introduced to Machine Learning.
This beginner course will introduce the basic concepts of Machine Learning using the Nexosis API and some simple data about each passenger aboard the Titanic. Given this data, we’ll show how Machine Learning can be used to build a model to predict a passenger’s survivability based on factors such as age, gender, as well as a measure of socio-economic status.
Time: 10 minutes
Level: Introductory / 101
Prerequisites:

Outline
Understanding the problem:
- Initial understanding
- Data Sets
- Submitting the Data to Nexosis
- Building the Model
- Results
- Next Steps
Problem Definition
Initial Understanding
First step for any model building process is making sure you have a basic understanding of the problem. In this scenario, we’re going to try and predict if a passenger would survive if they’re on the Titanic. With this in mind, here are some of the initial factors we believe have an impact on survival rates:
- Gender and age - “women and children first”
- Wealth - first class fared better than third class
The Titanic had 20 lifeboats which could accommodate a total of 1,178 people. However, there were 2,224 people onboard (Note: this is disputed and we’ll talk about that later). Even more interesting is that only 728 people survived, well below the capacity that the lifeboats could accommodate.
Some immediate questions you should think about:
How many women, children, and men were on board? What class were they in? What about the crew? Why were there only 728 survivors – only ~62% of capacity of the lifeboats.
Programming Approach
We’re going to take an agile approach to machine learning during this course. This means we’ll be starting with what we believe is the minimum and adding to it over time. We’ll be trying things, seeing what happens, and adjusting from there.
Machine Learning Approach
With machine learning the primary focus is on the data being used to create our model. Upfront we believe the following data points or features support our stated problem above:
- Gender
- Class (first class, second class, third class)
- Age
- Spouse / Children
- Price of Ticket
- Port of Embarking
Datasets
We’re going to start off by using a slightly modified version of the Kaggle Titanic training and testing datasets. You can grab the training dataset here.
The training dataset is what we’ll use to build our model. The test dataset is how we’ll evaluate the model accuracy.
Training Data
Open up titanic-train.csv in Google Sheets or Microsoft Excel. You should see columns titled
| Survived | Pclass | Embarked | Sex | Age | SibSp | Parch | Fare |
You’ll notice that some columns are missing data. Don’t worry about this for now.
Install Postman and the Nexosis API Collection (if you haven’t already done so). For instructions on how to install the Nexosis Postman collection, read our Support Document How to Install Postman and the Nexosis API Collection
DIRECTIONS
Submitting the Data to Nexosis
We’re going to use Postman to submit our data via the Nexosis API to create a model.
- The Nexosis API Collections should be listed in postman on the left-hand side. Open the Data folder and click
PUT /data/:dataSetName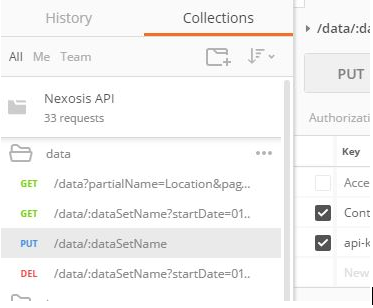
- Click on Headers and add keys and values.
Key Value api-key your unique API key Content-Type text/csv
For directions to find your API key, click HERE.

- Click the
Paramsbutton just to the right the URL in Postman. In theKeycolumn, find the parameter that is associated with the URL parameter:dataSetNamein the list and type in your dataset name in the field in the column namedValue.

- Click
Body, and selectraw, and paste the contents of the CSV data in the box.
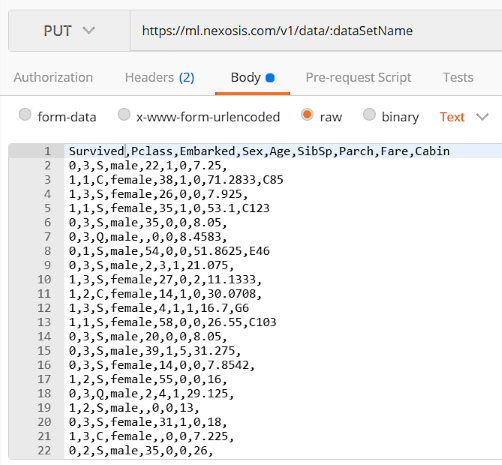
- Click the blue
Sendbutton to the Right of the URL in Postman.

- If all went well, you should be able to scroll down under the request and see the response with a status code of
201 Createdwith aBodythat looks something like this: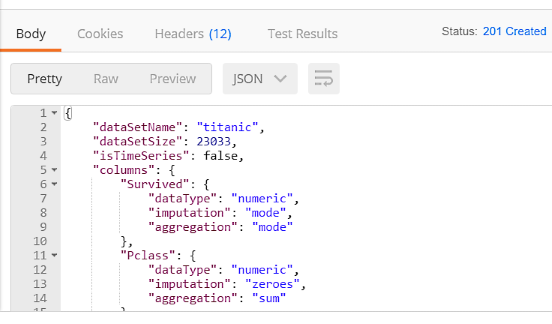
Building the Model
- From the Nexosis API Collections, open the Sessions folder and click
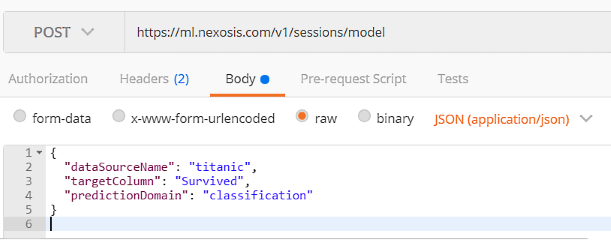
POST /sessions/model.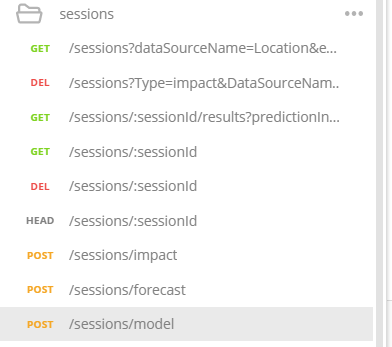
If you don’t have the Nexosis API collections, you can simply selectPOSTfrom the dropdown and typehttps://ml.nexosis.com/v1/sessions/modelin the text bar.
- Click
Bodyand paste the following code. - Note:dataSourceNamemust match whatever you named your dataset at the beginning.
{
   "dataSourceName": "titanic",
   "targetColumn": "Survived",
   "predictionDomain": "classification"
}
You should have a POST request that looks like this:
- Click the blue
Sendbutton to the Right of the URL in Postman.

When you scroll to the bottom of the body, you will see your unique session ID and the responsestatusshould sayrequestedorstarted.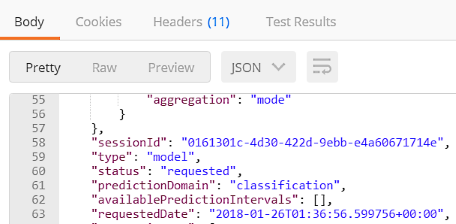
Important: Copy your
SessionIDout of the response body as you will need this in the subsequent steps.
Check if Session is complete:
When the model is finished, you will receive an email with your session ID. You can also check the status of your session in Postman. To do this, you will need the session ID you copied from the previous step.
-
Open the Sessions folder and click
GET /sessions/:sessionId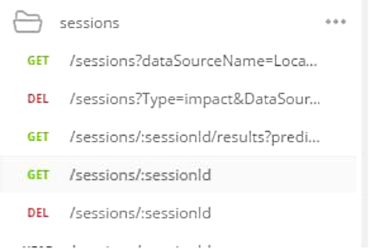
- Click
Paramsand paste the unique session ID forsessionIdValue.Note: Your session ID can be found on the previous Postman tab. For this example, the
sessionIdis0161301c-4d30-422d-9ebb-e4a60671714e.
- Click the blue
Sendbutton to the Right of the URL in Postman.

- Scroll to the bottom to check if the status has completed. If the status has completed, your model ID will be provided.
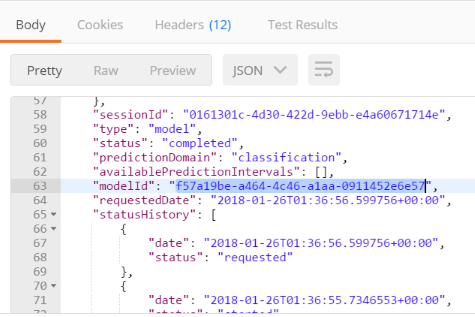
Important: Copy your unique model Id. For this example the
modelIDisf57a19be-a464-4c46-a1aa-0911452e6e57
Results
Now that the model has been created, is it any good? The Session results will contain metrics and the results of an internal test set.
- Open the Sessions folder and click
GET /sessions/:sessionId/results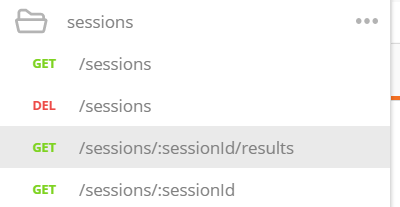
- Click Params and paste the unique session ID for
sessionIdValue.Note: Your session ID can be found on the previous Postman tab. For this example, the
sessionIdis0161301c-4d30-422d-9ebb-e4a60671714e.
- Click the blue
Sendbutton to the Right of the URL in Postman.

- The Session Result response body contains both metrics of how accurate the model’s predictive capabilities, as well as the test data used to calculate the model’s accuracy.
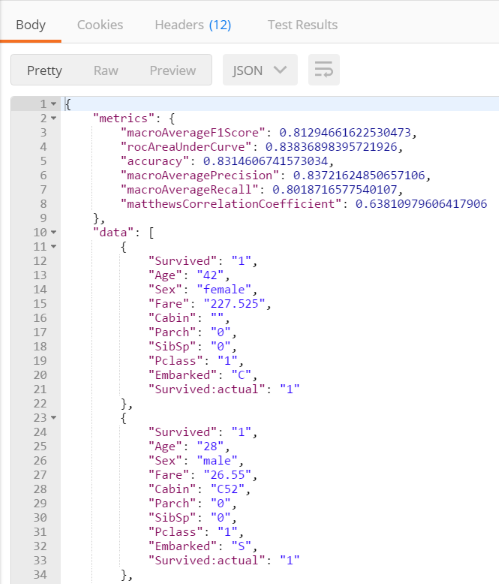
Understanding the Results
The metrics returned in the session results as follows:
{
    "metrics": {
        "macroAverageF1Score": 0.81294661622530473,
        "rocAreaUnderCurve": 0.83836898395721926,
        "accuracy": 0.8314606741573034,
        "macroAveragePrecision": 0.83721624850657106,
        "macroAverageRecall": 0.8018716577540107,
        "matthewsCorrelationCoefficient": 0.63810979606417906
    },
    ...
For this introduction, we’ll only focus on the accuracy metric. The accuracy metric reads 0.8314606741573034 - which can be converted to a percent by multiplying by 100. The accuracy of this model is ~83%, meaning that when Nexosis analyzed the test set against the model, 83% of the predictions made by the model were correct.
Test Data
The data section in the session results contains the internal test set used to calculate the accuracy metrics. Notice there is two Survived fields - Survived:actual and Survived. Survived:actual is the original field used to train the model, and Survived is the value predicted by the model. In the two example cases below, the actual matches the predicted.
...
 "data": [
        {
            "Survived": "1",
            "Age": "42",
            "Sex": "female",
            "Fare": "227.525",
            "Cabin": "",
            "Parch": "0",
            "SibSp": "0",
            "Pclass": "1",
            "Embarked": "C",
            "Survived:actual": "1"
        },
        {
            "Survived": "1",
            "Age": "28",
            "Sex": "male",
            "Fare": "26.55",
            "Cabin": "C52",
            "Parch": "0",
            "SibSp": "0",
            "Pclass": "1",
            "Embarked": "S",
            "Survived:actual": "1"
        },
    ...
How to Use the Results
Now that the model exists, a prediction endpoint is available that can be used to provide predictions.
- Open the
modelsfolder and clickPOST /models/:modelId/predict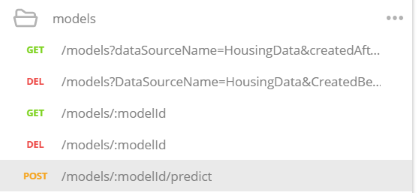
- Click Params and paste the model ID for
modelIdValue.
- Next, click Body and paste the following code:
 {
 "data": [
        {
         "Pclass":  "3",
         "Sex":  "male",
         "Age":  "34.5",
         "SibSp":  "0",
         "Parch":  "0",
         "Fare":  "7.8292",
         "Cabin":  "",
         "Embarked":  "Q"
     },
     {
         "Pclass":  "3",
         "Sex":  "female",
         "Age":  "47",
         "SibSp":  "1",
         "Parch":  "0",
         "Fare":  "7",
         "Cabin":  "",
         "Embarked":  "S"
     }
 ]
}
The above JSON represents the data of two different Titanic passengers. By sending these features to the predict endpoint in the request body, the model’s prediction of their survivability will be returned.
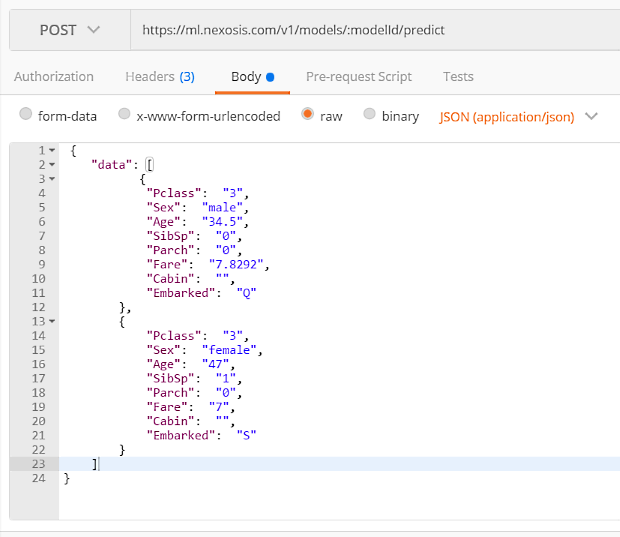
- Click the blue
Sendbutton to the Right of the URL in Postman.

- Scroll down to see the Response. The predicted
Survivedfield will be included along with the features submitted.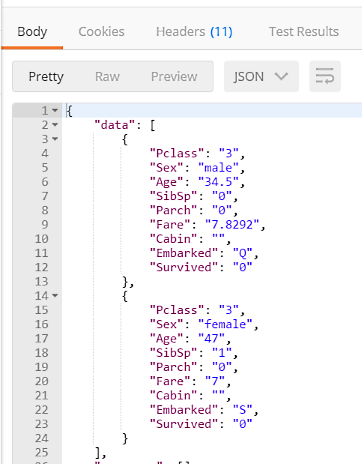
Batch Predictions
As shown in the previous example, more than one set of features can be submitted at once as a batch. Currently the prediction endpoint only allows JSON formatted input but will soon allow CSV.
Here’s the slightly modified version of the Kaggle Titanic test dataset formatted in JSON. You can grab this dataset here.
By repeating the previous prediction 5 steps above (don’t forget to set your ModelID), you can submit a much larger set of predictions like so:
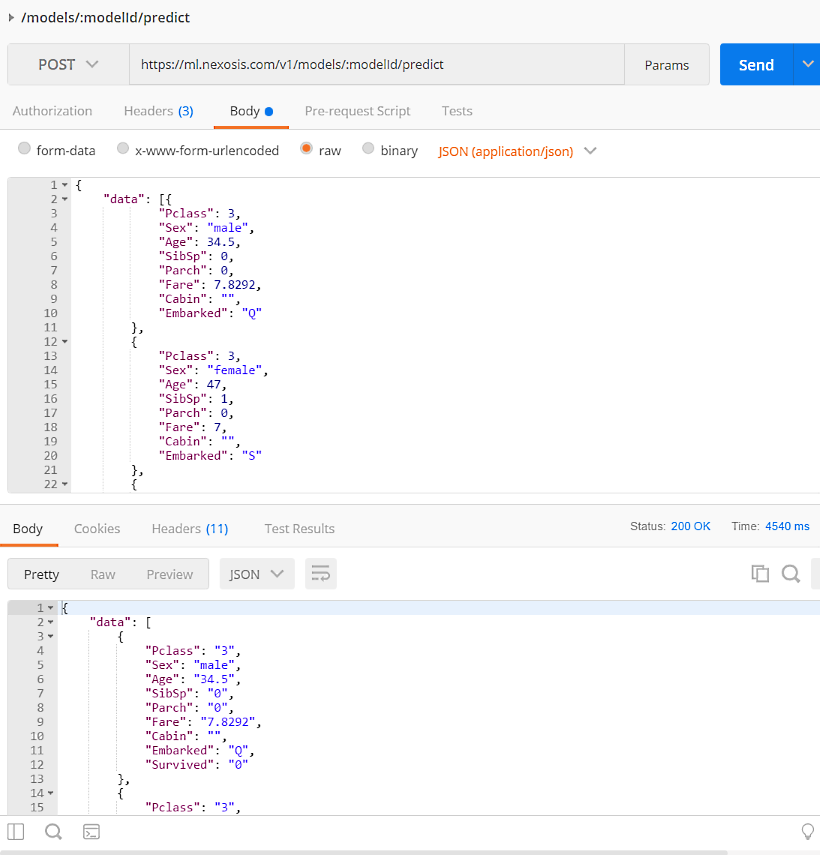
Note: It’s important not to submit too many predictions. If the JSON body is too large, it will time-out and you will receive an error.
Next Steps
I started writing this tutorial on the belief that the Titanic is the ‘hello world’ of machine learning. However, after building this model I’m starting to re-think this, as should you.
Here are some questions we’ll be looking into in part 2 of this series:
- What about the crew?
- Why were the lifeboats only at 62% capacity?
- How much do we really trust this dataset?
