Classification
Forecasting
Forecasting Website Traffic
This sample tutorial will show you how use Google Analytics Web Session data to forecast future web sessions and see the impact of certain activities on web sessions.
Getting Started
To get started, you’ll need a Nexosis API account. Once you have an account, you can retrieve your API Key here. Next you can install the PSNexosisClient powershell module, clone this repo and Import the modules.
To follow along, you can install the module or clone it from git.
PS> Install-Module -Name PSNexosisClient
PS> git clone https://github.com/Nexosis/sample-ps-websiteforecasts.git
PS> cd sample-ps-websiteforecasts
PS> Import-Module .\PSNexosisWebAnalytics
PS> $env:NEXOSIS_API_KEY = '<yourkeyhere>'
Note: This Powershell module uses Microsoft Chart Controls for Microsoft .NET Framework 3.5. You may need to install this to generate and save the graphs.
Loading Analytics Data from Exported CSV
Log into your Google Analytics account and Navigate to your Analytics Account for the Web Site you are interested in. Expand Audience in the Left Navigation and then choose Overview. Before exporting the CSV, make sure the date range has enough historical data.
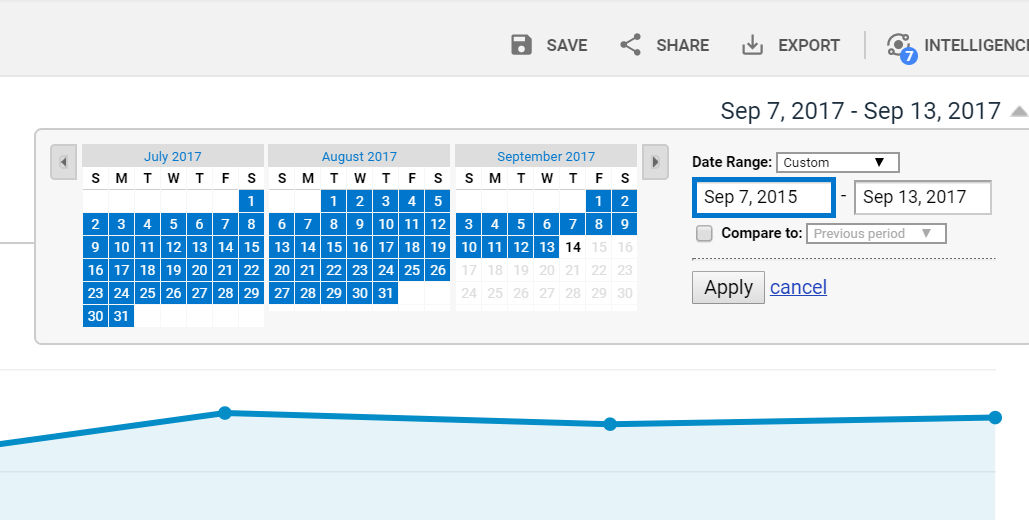
Select Date Range
Next, using the Date Selector in the upper right, choose a custom range using a year or two of data. More is ideally better - somewhere between one and two years is probably good enough. You can test which works better through trial and error.
Export and Save the CSV File
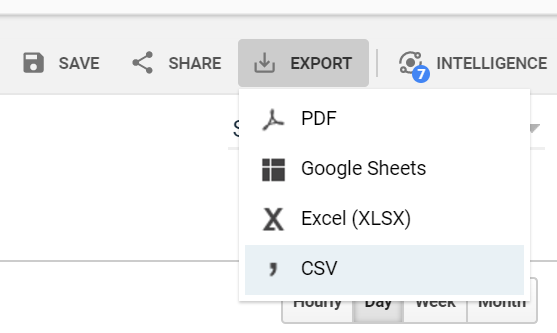
Once the data range is selected, click the Export button above the Date Chooser and select CSV. Save this file - we’ll include sample data as well.
Here’s an example of how Google Analytics stores their CSV, there’s an Hour Index starting from the first date indicated in the header comment. This Hour Index then increments each hour by adding one through to the end of the file:
# ----------------------------------------
# All Web Site Data
# Audience Overview
# 20150701-20170831
# ----------------------------------------

Hour Index, Sessions
0, 0
1, 0
2, 0
3, 0
4, 0
5, 0
6, 0
7, 0
...snip...
66820, 0
66821, 0
66822, 11
66823, 75
66824, 233
66825, 215
66826, 197
66827, 194
66828, 177
66829, 187
66830, 178
66831, 142
66832, 68
66833, 28
66834, 11
66835, 13
66836, 12
66837, 12
66838, 10
66839, 2
66840, 3
66841, 0
66842, 0
66843, 0
66844, 0
66845, 1
66846, 9
66847, 60
66848, 195
66849, 206
66850, 191
66851, 167
66852, 160
66853, 188
66854, 156
66855, 148
66856, 76
66857, 24
66858, 15
66859, 10
66860, 14
66861, 4
66862, 10
66863, 0
Once the CSV is saved, it can be uploaded to the API Nexosis API using a script created called Invoke-NexosisUploadAnalyticsCsv.
To submit to the Nexosis API, this Hour Index needs converted to an ISO 8601 formatted time date stamp. See Working With Dates for a broader explanation. This script takes care of the date / time conversion and reformates it into a CSV the Nexosis API can handle.
PS> Invoke-NexosisUploadAnalyticsCsv -dataSetName 'sampleWebSiteData' `
                                     -sourceAnalyticsFile 'path\to\AnalyticsFile.csv'

Dataset sampleWebData already exists. Updating existing dataset.
Reading Google Analytics date range from header...
CSV Starts on date 2015-07-01 and ends on 2017-08-31.
Processing CSV File...
Parsed 19032 records.
Uploading Dateset sampleWebData...

Successfully uploaded Google Analytics csv.
dataSetName   columns
-----------   -------
sampleWebData @{Sessions=; timestamp=}
Click here for the complete source of this PowerShell script:
Let’s take a quick look at the logic needed to import this CSV by reviewing excerpts of the code in Invoke-NexosisUploadAnalyticsCsv.ps1 script.
Steps to Convert and Upload Google Analytics File
- Parse date range from the comments in the top of the file
- Combine the Start Date from the header with the Hours Index to calculate hourly timestamp
- Transform it to a new formatted CSV that Nexosis API can process
- Upload the file to Nexosis API using
Import-NexosisDataSetFromCsv
# Line 3 (0 indexed) in the CSV contains the date range of hourly sessios in the file.
# (e.g. 20150701-20170831). Parse this with regular expressions and re-write then and
# store them as 2015-07-01 and 2017-08-31 in $minDate and $maxDate.
$line3 = Get-Content $sourceAnalyticsFile | Select-Object -index 3
# Create Regex with 6 groups to capture date parts and re-combine them in the needed format
$regex = '^# (\d{4})(\d{2})(\d{2})-(\d{4})(\d{2})(\d{2})$'
$minDate = $line3 -replace $regex, '$1-$2-$3'
$maxDate = $line3 -replace $regex, '$4-$5-$6'
# Load the CSV file converting Hour Index to DateTime using $minDate and DateTime.AddHours()
# Discard any row that doesn't match the the regex '^\d+,\d+$'
$websiteDataObservations = Get-Content $sourceAnalyticsFile `
                                    | select-string -pattern '^\d+,\d+$' `
                                    | ConvertFrom-Csv -header @('HourIndex','Sessions') `
                                    | Select-Object  @{label='timestamp'; `
                                                    expression = { `
                                                        ([DateTime](get-date $minDate).AddHours($_.HourIndex).ToString("o"))}`
                                                }, `
                                                @{label='Sessions'; `
                                                    expression = {[int]$_.Sessions}`
                                                }

# Finally, write the file as a new CSV to submit. Limiting the number of rows
# to a limited amount. Setting $numObservationsToSubmit to ~12,000 equals
# aprox 1.37 years of hourly observations
 Out-File -FilePath $preppedCsvOutputFile `
          -Encoding ascii `
          -InputObject $($websiteDataObservations `
                            | Select-Object -last $numObservationsToSubmit `
                            | ConvertTo-Csv -NoTypeInformation `
                        )

# Finally submit this new CSV to the Nexosis API
Import-NexosisDataSetFromCsv -dataSetName $dataSetName `
                             -csvFilePath $preppedCsvOutputFile
Now that the file is uploaded, Forecast and Impact sessions can be created.
Forecasting Web Sessions
Now that the data is in the API, we can build a forecast model. This is easily accomplished by calling Start-NexosisForecastSession with a forecast start and end date. I could look at the data to choose the start and end dates, but for fun, I wrote a method that will calculate a forecast range based on the dataset called Get-NexosisForecastDateRange.
In this example, we retrieve the sampleWebData, pass it into our script to calculate start and end forecast dates for hourly intervals for 2 weeks (14 days * 24 hours) and then use that as the start and end dates for the forecast session:
PS> $dataset = Get-NexosisAllDataSetData -dataSetName 'sampleWebData'
PS> $range = Get-NexosisForecastDateRange -observations $dataSet.data `
                                          -timeStampColumnName timestamp `
                                          -interval hour `
                                          -intervalCount (14*24)
PS> $range

Name                           Value
----                           -----
forecastEnd                    2017-09-15T00:00:00.0000000
forecastStart                  2017-09-01T00:00:00.0000000

PS> Start-NexosisForecastSession -dataSourceName 'sampleWebData'  `
                                 -targetColumn 'Sessions' `
                                 -startDate $range.forecastStart `
                                 -endDate $range.forecastEnd `
                                 -resultInterval Day

sessionId       : 015e766c-2430-46e5-9c22-68d6ba63c52e
type            : forecast
status          : requested
requestedDate   : 2017-09-12T14:09:12.240809+00:00
statusHistory   : {@{date=2017-09-12T14:09:12.240809+00:00; status=requested}}
extraParameters :
messages        : {}
columns         : @{Sessions=; timestamp=}
dataSourceName  : sampleWebData
dataSetName     : sampleWebData
targetColumn    : Sessions
startDate       : 2017-09-01T00:00:00+00:00
endDate         : 2017-09-15T00:00:00+00:00
resultInterval  : day
links           : {@{rel=results; href=https://ml.nexosis.com/v1/sessions/015e766c-2430-46e5-9c22-68d6ba63c52e/results}, @{rel=data; href=https://ml.nexosis.com/v1/data/sampleWebData}}
Impact of Event On Web Sessions
Let’s take a look at our web traffic and see if there was significant on our web site traffic when we released the Nexosis API.
We launched the Public API on July 10, 2017 - let’s create a session to see that impact over the next couple months:
PS> Start-NexosisImpactSession -dataSourceName nexosisWebSiteTraffic `
                               -targetColumn sessions `
                               -eventName 'api release' `
                               -startDate 2017-07-10 `
                               -endDate 2017-08-31 `
                               -resultInterval Day


sessionId       : 015e80fc-48f8-426c-994a-59a6053c1228
type            : impact
status          : requested
requestedDate   : 2017-09-14T15:22:50.997124+00:00
statusHistory   : {@{date=2017-09-14T15:22:50.997124+00:00; status=requested}}
extraParameters : @{event=}
messages        : {}
columns         : @{Sessions=; timestamp=}
dataSourceName  : nexosisWebSiteTraffic
dataSetName     : nexosisWebSiteTraffic
targetColumn    : Sessions
startDate       : 2017-07-10T00:00:00+00:00
endDate         : 2017-08-31T00:00:00+00:00
resultInterval  : day
links           : {@{rel=results; href=https://ml.nexosis.com/v1/sessions/015e80fc-48f8-426c-994a-59a6053c1228/results}, @{rel=data; href=https://ml.nexosis.com/v1/data/nexosisWebSiteTraffic}}
Waiting for Session To Complete
Since building a Time Series model is asynchronous, it goes off and does work and when it’s done we can retrieve the results.
Checking on the status of a Session is simple. The PSNexosisClient has a command called Get-NexosisSessionStatus that will return the status of the Session given a session Id - potential results are ‘Started’, ‘Requested’, ‘Completed’, ‘Cancelled’, and ‘Failed’.
To monitor a session, there’s a sample command called Invoke-NexosisMonitorSession which monitors the session’s status (10 second intervals) and return when the status is no longer ‘Requested’ or ‘Started’.
PS> Invoke-NexosisMonitorSession -sessionId 015e76da-da55-4db8-9e6b-cc480c726030
Monitoring session 015e76da-da55-4db8-9e6b-cc480c726030
Session completed. Final status is 'Completed'
Here’s some of the internal code of Invoke-NexosisMonitorSession to show how to check session status. This will get current status and then poll every 10 seconds to see if it is in a state other than Requested or Started.
$sessionStatus = Get-NexosisSessionStatus -SessionId $sessionID

# Loop / Sleep while we wait for model and predictions to be generated
while ($sessionStatus -eq 'Started' -or $sessionStatus -eq "Requested") {
    Start-Sleep -Seconds 10
    $sessionStatus = (Get-NexosisSessionStatus -SessionId $sessionID)
}
Retrieve the Session Forecast Results
Once the sessions have completed, extracting the results is possible using Get-NexosisSessionResult with the appropriate session ID.
PS> Get-NexosisSessionResult -SessionId 015e766c-2430-46e5-9c22-68d6ba63c52e

metrics         :
data            : {@{timestamp=2017-08-18T00:00:00.0000000Z; sessions=70}, @{timestamp=2017-08-18T01:00:00.0000000Z; sessions=23}, @{timestamp=2017-08-18T02:00:00.0000000Z; sessions=1}, @{timestamp=2017-08-18T03:00:00.0000000Z;
                  sessions=3}...}
sessionId       : 015e766c-2430-46e5-9c22-68d6ba63c52e
type            : forecast
status          : completed
requestedDate   : 2017-09-12T21:51:26.604239+00:00
statusHistory   : {@{date=2017-09-12T21:51:26.604239+00:00; status=requested}, @{date=2017-09-12T21:51:26.4093991+00:00; status=started}, @{date=2017-09-12T22:09:04.0363456+00:00; status=completed}}
extraParameters :
messages        : {@{severity=informational; message=12000 hourly observations were found in the dataset between 2015-10-16T01:00:00.0000000Z and 2017-08-17T23:00:00.0000000Z.}, @{severity=informational; message=1484 hourly
                  observations were found in the dataset between 2017-05-26T16:00:00.0000000Z and 2017-08-17T23:00:00.0000000Z.}}
columns         : @{Sessions=; timestamp=}
dataSourceName  : sampleWebData
dataSetName     : sampleWebData
targetColumn    : sessions
startDate       : 2017-09-01T00:00:00+00:00
endDate         : 2017-09-15T00:00:00+00:00
resultInterval  : hour
links           : {@{rel=results; href=https://ml.nexosis.com/v1/sessions/015e766c-2430-46e5-9c22-68d6ba63c52e/results}, @{rel=data; href=https://ml.nexosis.com/v1/data/sampleWebData}}
To just retrieve the forecast data, you can inspect the data member of the returned object like so:
PS> (Get-NexosisSessionResult -SessionId 015e766c-2430-46e5-9c22-68d6ba63c52e).Data

timestamp                    sessions
---------                    --------
2017-08-18T00:00:00.0000000Z 70
2017-08-18T01:00:00.0000000Z 23
2017-08-18T02:00:00.0000000Z 1
2017-08-18T03:00:00.0000000Z 3
2017-08-18T04:00:00.0000000Z 0
2017-08-18T05:00:00.0000000Z 18
2017-08-18T06:00:00.0000000Z 76
2017-08-18T07:00:00.0000000Z 516
2017-08-18T08:00:00.0000000Z 0
2017-08-18T09:00:00.0000000Z 0
2017-08-18T10:00:00.0000000Z 0
2017-08-18T11:00:00.0000000Z 0
2017-08-18T12:00:00.0000000Z 0
2017-08-18T13:00:00.0000000Z 0
...snip...
2017-08-31T13:00:00.0000000Z 0
2017-08-31T14:00:00.0000000Z 0
2017-08-31T15:00:00.0000000Z 0
2017-08-31T16:00:00.0000000Z 0
2017-08-31T17:00:00.0000000Z 711
2017-08-31T18:00:00.0000000Z 403
2017-08-31T19:00:00.0000000Z 226.5
2017-08-31T20:00:00.0000000Z 266.5
2017-08-31T21:00:00.0000000Z 307
2017-08-31T22:00:00.0000000Z 294
2017-08-31T23:00:00.0000000Z 185
I’ve written a few commands that allow a user to list and select DataSets and Sessions to view graphically and save an image of the output. Once you have datasets and sessions, you can run Invoke-NexosisGraphDataSetAndSession to browse and graph results from those datasets.
PS>  Invoke-NexosisGraphDataSetAndSession

# dataSetName
- -----------
0 nexosisWebSiteTraffic
1 sampleWebSiteTraffic

Which dataset would you like to return? (ctrl-c to exit): 1

# dataSourceName       type     resultInterval startDate             endDate               status
- --------------       ----     -------------- ---------             -------               ------
0 sampleWebSiteTraffic forecast day            8/17/2017 12:00:00 AM 8/31/2017 12:00:00 AM completed
1 sampleWebSiteTraffic forecast hour           8/17/2017 12:00:00 AM 8/31/2017 12:00:00 AM completed

Which session would you like to return? (ctrl-c to exit):  0
Retrieving historical observations...
At this point a graph will show up with the historical observations and the forecasted data.
Here are some sample outputs.
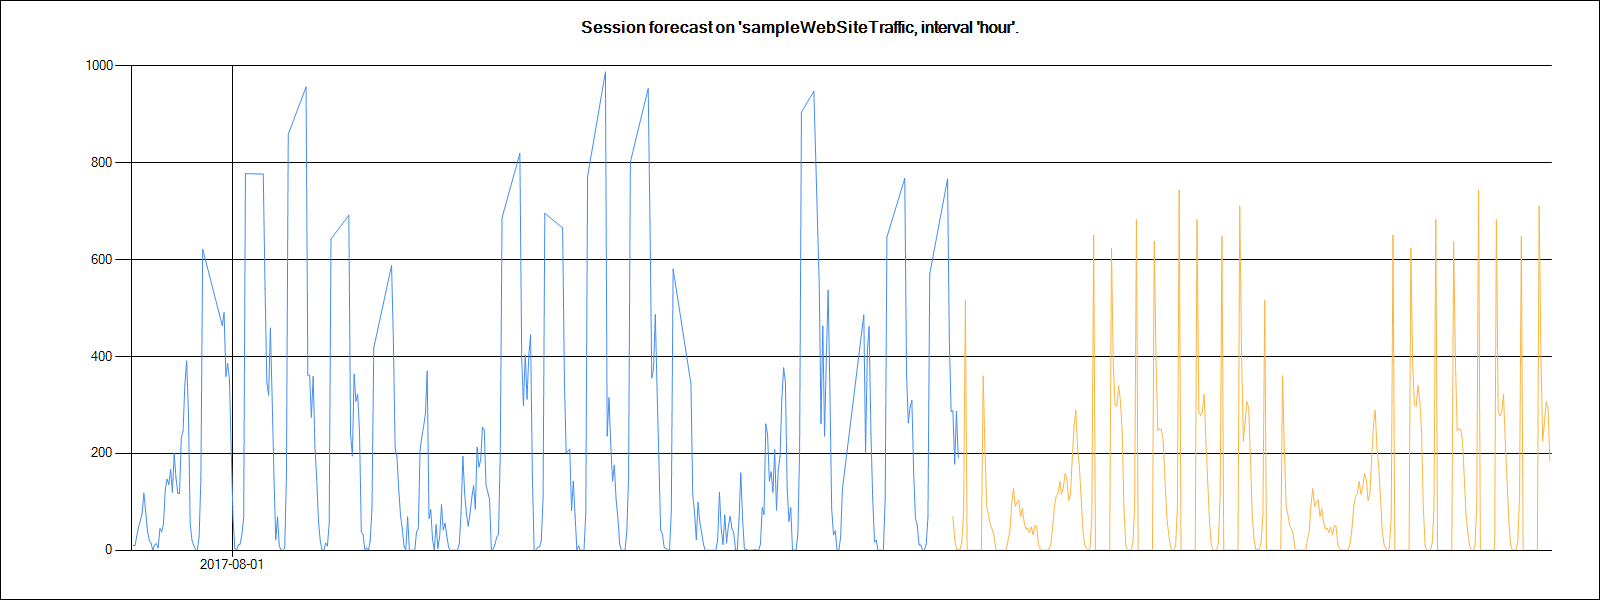
Example Showing Historical Hourly WebSite Traffic Forecasted Two Week
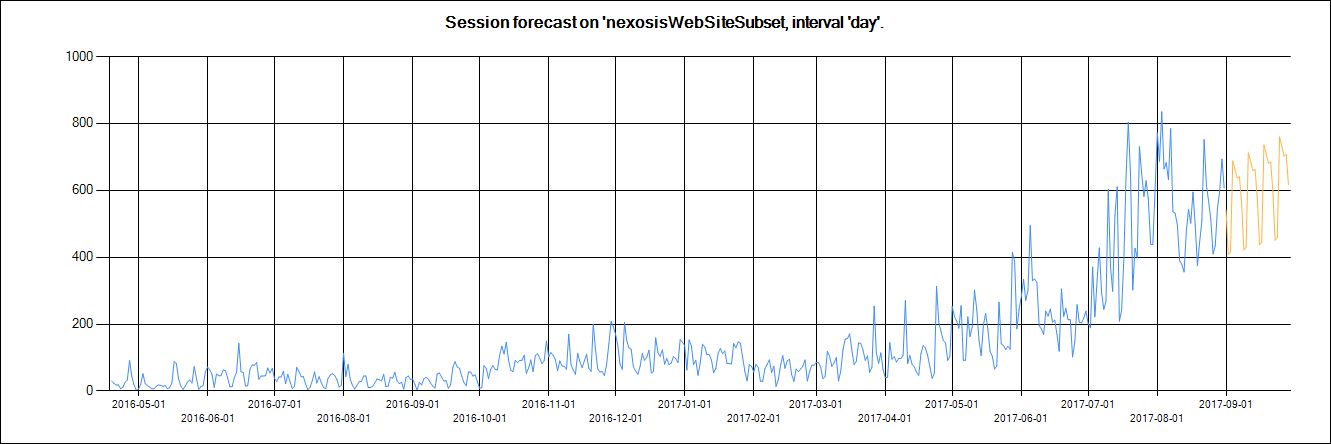
Example Showing Historical Daily WebSite Traffic Forecasted
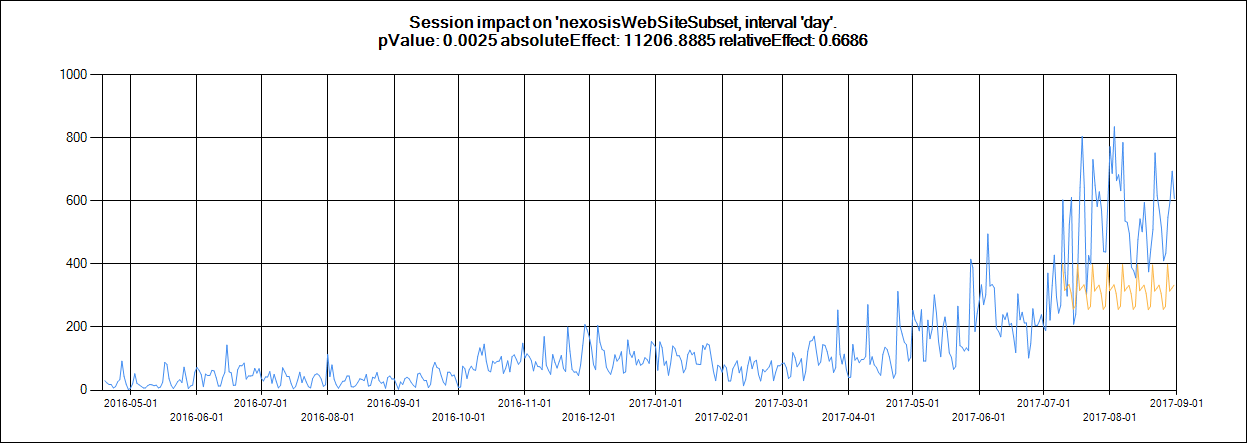
Example Showing Historical Daily WebSite Traffic and Impact Calculated
The results for our Impact analysis show a pValue of 0.0025, or very close to 0. This indicates there was a strong statistical significance of the impact of the event during the specified time period.
pValue: 0.0025
absoluteEffect: 11206.8885
relativeEffect: 0.6686
Relative effect is showing a ~67% increase. The absolute effect is showing the area under the curve in the chart below that’s between the orange and blue line during the impact period.
Try It Yourself!
To try it on your Google Analytics data, install the module or clone it from git here!
Commands Contained in this Sample Module
Here is a list of all commands coded for this Sample PowerShell Module
Public Scripts
Get-NexosisAllDataSetData -            Illustrates how to implement paging to download ALL data.

Invoke-NexosisGraphDataSetAndSession - An example interactive tool to choose DataSets
                                       and retrieve associated Sessions and then build a
                                       PNG chart of the results.

Invoke-NexosisMonitorSession -         Shows how to monitor an active Nexosis API Session and wait
                                       for it to complete.

Invoke-NexosisUploadAnalyticsCsv -     Takes an csv file formatted specifically from Google Analytics
                                       Export and transforms and uploads it to Nexosis API.
Private
These are some private scripts in the PS Module that are used to provide some PowerShell command line interface:
Get-NexosisForecastDateRange -          Illustrates how to calculate a forecast start and end date /
                                        times using historical data.

Get-NexosisFormatDataForGraphing -      Illustrates how to prepare Nexosis Data for graphing in a
                                        custom .NET library.

Invoke-NexosisDataSetChooser -          A simple command that allows you to interactively show and
                                        choose a dataset. Script returns DataSetData object.

Invoke-NexosisGraphDataSets -           Sample showing how to use Microsoft Chart Controls for
                                        Microsoft .NET Framework 3.5 to graph output.

Invoke-NexosisSessionChooser -          A simple command that allows you to interactively show and
                                        choose a Session. Script returns SessionResult object.

Invoke-SaveDialog -                     A simple command that creates a Save Dialog box to allow
                                        saving of an Image file generated by the graphing library.
