Classification
Forecasting
Forecasting Regional Housing Values
This sample application is intended to show very simple usage of the Nexosis API in Scala using the Java client library to forecast region level house value and plot the results. If you are following along, you will be able to to analyze data provided by Zillow that contain historical house values in different regions.
Zillow provides the data under the following Terms and Conditions
You can follow along using the full source code in github.
Getting Started
To get started using the Nexosis API with Scala, you’ll need the Scala Client Library.
Add this dependency to build.sbt:
resolvers +=
  Resolver.sonatypeRepo("public")
libraryDependencies += "com.nexosis" % "nexosisclient-java" % "1.1.2"
Source Data
We will not be distributing the source data. You can find source files and download them on the Zillow ZHVI Research Data site.
The source data contains a row for each region, along with the Name, SizeRank and then columns for the Value for the region starting in April 1996 and continues through May of 2017.
RegionID, RegionName, SizeRank, 1996-04, 1996-05, 1996-06, 1996-07, ..., 2017-02, 2017-03, 2017-04, 2017-05
9, California, 1,95100,94900,94500,94400,94400, ...,261500,263500,265800,267800
To create a dataset we can work with, we’ll extract each row and populate a DataSet object and then create a new dataset.
Using the API
Parsing and Uploading Data
Always start by creating an instance of the NexosisClient.
  val client = new NexosisClient(
    sys.env("NEXOSIS_API_KEY")
  )
Most of the code in this tutorial is transforming the CSV data into a series of DataSets that can be individually submitted. Since there are 50 rows - one for each State region - we will need to create a dataset for each row.
Step 1 -Load Csv file and pass it to buildDatasets method:
  val sourceFile = s"${System.getProperty("user.dir")}/data/State_Zhvi_BottomTier.csv"
  val bufferedSource = Source.fromFile(sourceFile).getLines

  buildDatasets(client, bufferedSource, dataSetNameSuffix)
The buildDataSets method will transform 50 rows of State data into 50 DataSetData objects and submit each one individually to the Nexosis API.
Step 2 - Populate DataSetData Object
- Extract the header info and dates by calling
ExtractHeadersAndDates, which returns aDataSetDataobject that contains a series of all the dates for that region (since the dates are in the Header). - Iterate over each State’s House Value data (row) and assign each value to the appropriate Date using
getRegionalData()method.
Step 3 - Submit DataSet to the Nexosis API
Finally, the last bit of code submits the DataSetData object to the Nexosis API by calling client.getDataSets.create(name, dataset)
Here are steps 2 and 3 in Scala:
private def buildDatasets(client: NexosisClient, bufferedSource: Iterator[String], dataSetNameSuffix: String) = {
    // Extract the dates off of the first row / header columns in the CSV
    // and build a dataSetData object with all the dates
    val dataSetData = ExtractHeadersAndDates(bufferedSource)

    // Now loop over the rest of the rows to get each state's data row
    while (bufferedSource.hasNext) {
      val cells = bufferedSource.next.split(",(?=([^\"]*\"[^\"]*\")*[^\"]*$)")
      // Populate / Replace dataSetData cost data with data from the cells in the next row
      getRegionalData(dataSetNameSuffix, dataSetData, cells)

      // DataSet Data is complete, upload to the Nexosis API
      client.getDataSets.create(dataSetData.getDataSetName, dataSetData)
    }
  }
Creating a Forecast Session
Now that all 50 datasets from one of the CSV files are uploaded, we can create forecast sessions.
Earlier in the code, I created a naming scheme for the datasets so I could keep track of them.
The dataset naming scheme is as follows "${RegionName}-housedata-${timestamp}
    val timestamp: Long = System.currentTimeMillis / 1000
    val dataSetNameSuffix = s"-housedata-${timestamp.toString}"
    // ...much later in code ...
    // Strip out quotes, convert spaces to underscores, and toLower
    val dataSetName = cells(1).replace("\"", "").replace(" ", "_").toLowerCase() + dataSetNameSuffix;
So for RegionName California and Ohio, the dataset names would be called california-housedata-1500911996 and ohio-housedata-1500911996 for the given timestamp.
This allows us to easily and uniquely query the Nexosis API later and retrieve this list with one line of code using the suffix of -housedata-1500911996 as a partial match.
val dataSetList = client.getDataSets.list(dataSetNameSuffix)
Create 50 forecast Sessions
Now by looping over this list, we can create 50 forecast Sessions that will forecast the next 6 months of House Values by passing in the DataSet name to use, the target column to forecast, which is cost, and a start and end date. Finally, since we want a monthly forecast, we set the ResultInterval to MONTH.
dataSetList.getItems.forEach { item =>
  val session = client.getSessions.createForecast(
        item.getDataSetName(),
        "cost",
        DateTime.parse("2017-06-01T00:00:00Z"),
        DateTime.parse("2017-12-01T00:00:00Z"),
        ResultInterval.MONTH
      )
}
Now that we’ve created 50 sessions, we sit back and wait for all the models to be built, evaluated, and the best ones chosen to provide a forecast.
Waiting for Results
This can be achieved simply by polling the Nexosis API status.getStatus enum and waiting for it to no longer be SessionStatus.REQUESTED or SessionStatus.STARTED - REQUESTED means the Session has been created but the work has not started yet.
var status = client.getSessions.getStatus(session.getSessionId)

while ((status.getStatus == SessionStatus.STARTED)
        || (status.getStatus == SessionStatus.REQUESTED))  {
  Thread.sleep(5000)
  status = client.getSessions.getStatus(session.getSessionId)
}
Retrieve Session Results
After all 50 sessions have completed, we retrieve session results using client.getSessions.getResults() and retrieve the historical data, using client.getDataSets.get().
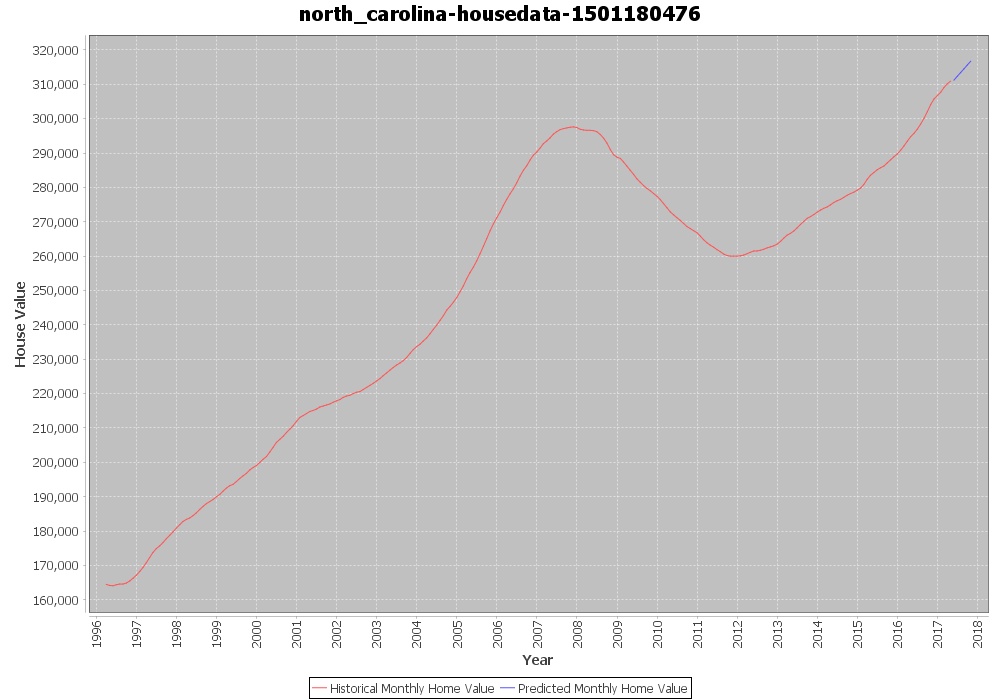
Finally, the results data and historical dataset data are passed into a plotTimeSeries() method that uses jfreechart to generate jpg files.
// Retrieve session data
val results = client.getSessions.getResults(session.getSessionId)

// Retrieve historical data
val dataset = client.getDataSets.get(results.getDataSetName, 0, 300, new util.ArrayList[String])

// Build plot using historical and prediction and save it to disk
plotTimeSeries(dataset, results)
Reviewing Results & Conclusions
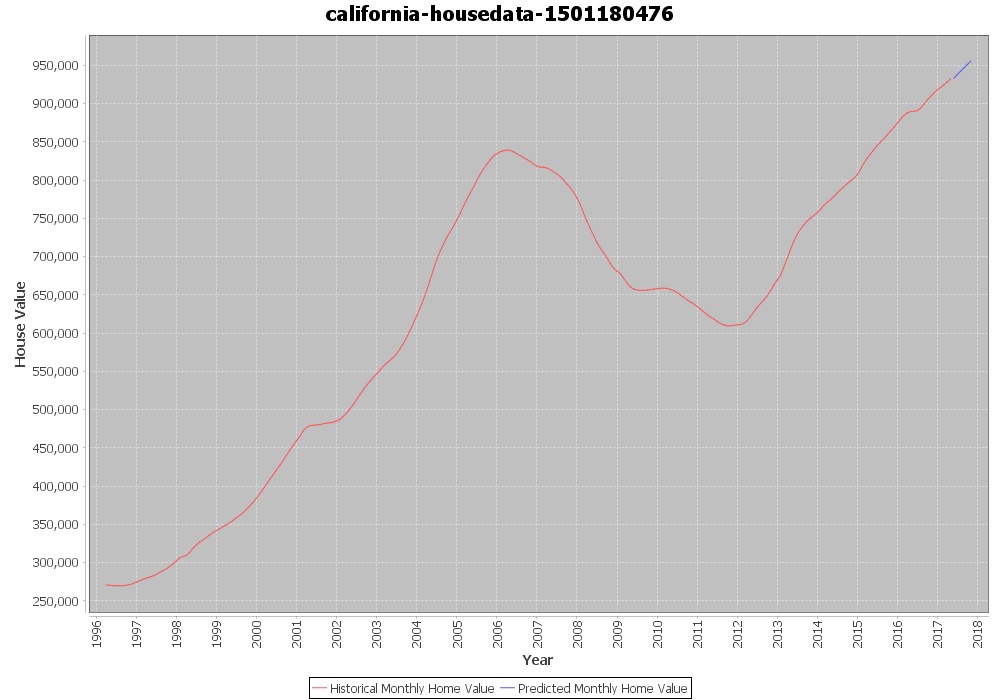
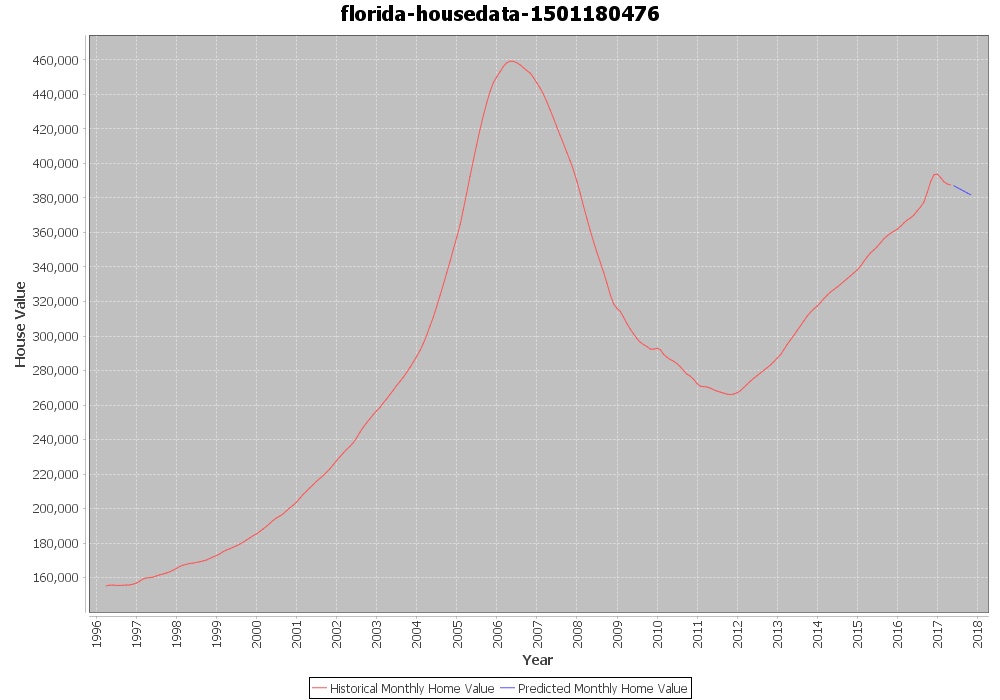
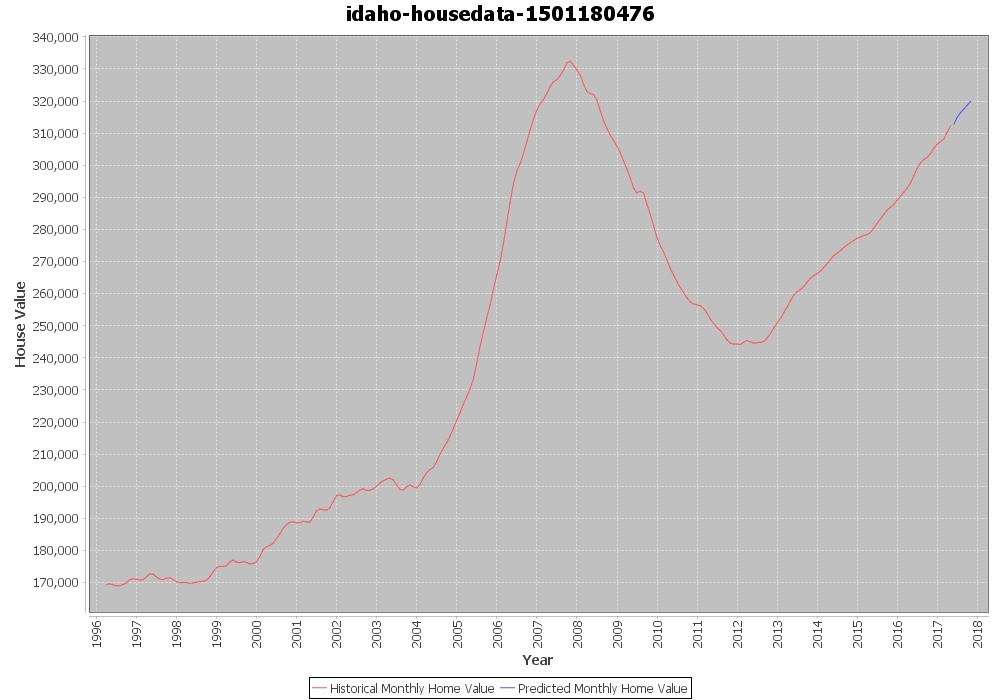
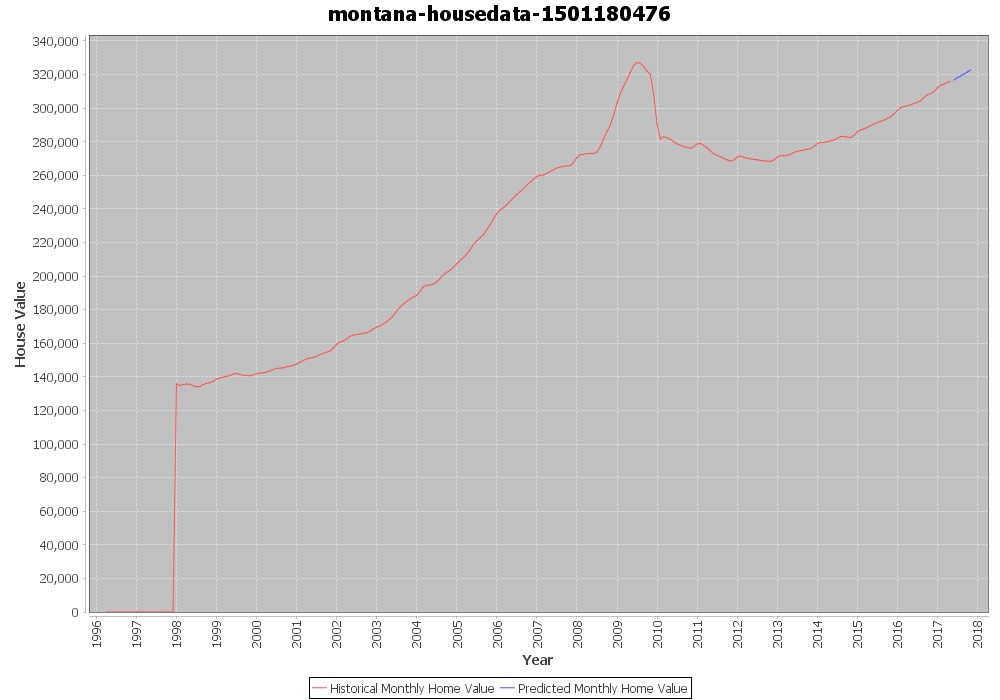
This is a very simple sample, using 10+ years of purely historical house values to predict 6 months of future house values for each state.
The obvious glaring missing piece to this is incorporating features that influence the housing values and incorporating those, such as economic factors. Even without that, the results are reasonable but will probably lack the forecasting power needed when things may change rapidly.
Here are a selection of forecasts - the red line is historical and the blue line is the predictions.
Zillow provides the data under the following Terms and Conditions
