Classification
Forecasting
Tournament Impact of Dungeon Crawl Stone Soup
Dungeon Crawl Stone Soup is a roguelike game which has been in active open source development since 2006. The game can be downloaded and played locally, or it can be played online in a web browser.
In this example, we are going to take a look at online games from one of the servers, http://crawl.akrasiac.org. This server has records of games going all the way back to 2006, but, we are only going to look at the last few years of data. Specifically, we will be looking at what happens to the number of Games, Players, and Wins during tournaments.
We will be using the Nexosis API to measure impact analysis using machine learning algorithms. And, we will be calling the API from F#. You can find the full source-code for this tutorial on GitHub: https://github.com/Nexosis/sample-fsharp-dcss
Tournament Games
Every time a new major version of DCSS is released, a player tournament is held. All online games played on the public servers are counted towards a player’s tournament score. Players form teams and earn points by winning games. Bonus points can also be earned by meeting special requirements during gameplay, such as winning in the fewest turns, or by getting the highest score. Since DCSS is very difficult, large numbers of games must be played in order to get a competitive tournament score. We are going to see just how many extra games are played during tournaments. To give an idea of the difficulty level, this is the percent of winning games in our dataset.
let totalWins = dataSet?Wins |> Stats.sum
let totalGames = dataSet?Games |> Stats.sum
(totalWins / totalGames) * 100.0
0.9684491638%
The Data
The data we are looking at is provided by one of the DCSS servers on per day basis. After downloading all of these records, we can truncate the dataset to 2012, since we are only going to be looking at tournaments from the 0.10 version onwards.
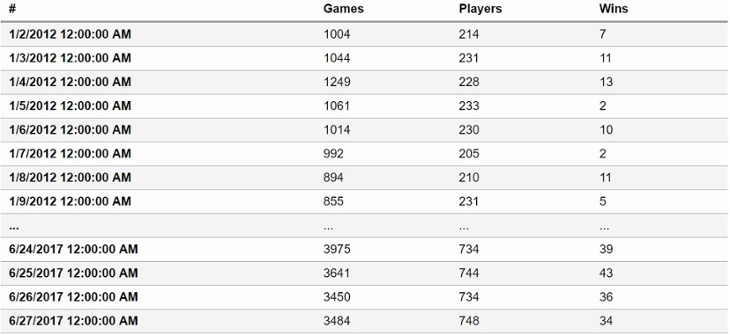
Using this dataset, we can run an impact analysis on any of the given columns that are uploaded. Before we begin, we can take a look at some of this data over time.
[
       dataSet?Games |> Series.observations
       dataSet?Players |> Series.observations
       dataSet?Wins |> Series.observations
]     |> Chart.Line
      |> Chart.WithLabels [ "Games"; "Players"; "Wins" ]

Uploading the data to a Nexosis dataset
Throughout this process, we will be using the SwaggerProvider library to communicate with the Nexosis API. This is all of the code needed to setup a connection to the API. If you would like to run this code, be sure to insert your API key in the source.
let addAPIKeyHeader (request:Net.HttpWebRequest) =
request.Headers.Add("api-key", apiKey)
request

type Nexosis = SwaggerProvider<Schema>

let nexosis = Nexosis(Url)
nexosis.CustomizeHttpRequest <- addAPIKeyHeader
Since we are going to be performing several different computations on this dataset, it will be easier to work with if we upload the data once, and then start running impact sessions to get measures afterwards. This will transform the data to the needed format, and then upload it to the Nexosis API.
let uploadData =
    let data = Nexosis.Data()
    data.Data  Series.observations
       |> Seq.map (fun (date,r) ->
            let frameRow = r.As()
            (Seq.append [("timestamp", date.ToString("o"))]
                (frameRow |> Series.observations)) |> Map.ofSeq) |> Seq.toArray
   data

nexosis.DatasetsAddData("DCSS", uploadData)
Now we can simply refer to this dataset by the name DCSS when starting an impact session.
Measuring impact
The dates of the latest tournament for version 0.20 are 2017-05-26 to 2017-06-11. Using these dates, we can start an impact session, providing one of the column names from our dataset. Let’s look at the numbers of wins first.
let latestWinsImpact = nexosis.SessionsCreateImpactSession("DCSS", "Wins", "0.20", "Day", "2017-05-26", "2017-06-11", null, None, null)
When the submitted session completes, we can download the results. The results will look something like the following:
let latestWinsImpactResults = nexosis.SessionsRetrieveResults latestWinsImpactSessionId
latestWinsImpactResults.Data
[|map [("Wins", "37.9019"); ("timestamp", "2017-05-26T00:00:00.0000000Z")];
  map [("Wins", "40.5301"); ("timestamp", "2017-05-27T00:00:00.0000000Z")];
  map [("Wins", "47.2656"); ("timestamp", "2017-05-28T00:00:00.0000000Z")];
  map [("Wins", "37.0279"); ("timestamp", "2017-05-29T00:00:00.0000000Z")];
  map [("Wins", "36.5758"); ("timestamp", "2017-05-30T00:00:00.0000000Z")];
  map [("Wins", "37.1082"); ("timestamp", "2017-05-31T00:00:00.0000000Z")];
  map [("Wins", "37.4585"); ("timestamp", "2017-06-01T00:00:00.0000000Z")];
  map [("Wins", "37.6149"); ("timestamp", "2017-06-02T00:00:00.0000000Z")];
  map [("Wins", "40.3788"); ("timestamp", "2017-06-03T00:00:00.0000000Z")];
  map [("Wins", "42.9223"); ("timestamp", "2017-06-04T00:00:00.0000000Z")];
  map [("Wins", "36.242"); ("timestamp", "2017-06-05T00:00:00.0000000Z")];
  map [("Wins", "37.1849"); ("timestamp", "2017-06-06T00:00:00.0000000Z")];
  map [("Wins", "37.0475"); ("timestamp", "2017-06-07T00:00:00.0000000Z")];
  map [("Wins", "37.6206"); ("timestamp", "2017-06-08T00:00:00.0000000Z")];
  map [("Wins", "37.8971"); ("timestamp", "2017-06-09T00:00:00.0000000Z")];
  map [("Wins", "40.6143"); ("timestamp", "2017-06-10T00:00:00.0000000Z")]|]
And, the Metrics property contains information about the measured impact of the tournament.
There was a strong indication that the tournament caused more games to be won than there normally would have been, since the pValue calculated was 0.000200. There were a total number of 1116.609500 additional wins over normal levels during the entire tournament. This was an increase of 179.700000% over what would have normally occurred during the same time period.
The returned metrics contain information about how impactful the tournament was on the win count. Using the Data property, we can see what the measured increase was over a normal time period, as if the tournament did not occur.

Looking at all tournaments
We can repeat this process for all of the tournaments. We can easily start an impact session for the combination of all tournaments and each of the data columns that were uploaded.
type Tournament = {
     Name:   string
     Start:  DateTime
     End:    DateTime
 }

let allTournaments =
    [
        { Name = "0.10"; Start = DateTime(2012, 02, 25); End = DateTime(2012, 03, 11) }
        { Name = "0.11"; Start = DateTime(2012, 10, 20); End = DateTime(2012, 11, 04) }
        { Name = "0.12"; Start = DateTime(2013, 05, 11); End = DateTime(2013, 05, 26) }
        { Name = "0.13"; Start = DateTime(2013, 10, 11); End = DateTime(2013, 10, 27) }
        { Name = "0.14"; Start = DateTime(2014, 04, 11); End = DateTime(2014, 04, 27) }
        { Name = "0.15"; Start = DateTime(2014, 08, 29); End = DateTime(2014, 09, 14) }
        { Name = "0.16"; Start = DateTime(2015, 03, 13); End = DateTime(2015, 03, 29) }
        { Name = "0.17"; Start = DateTime(2015, 11, 06); End = DateTime(2015, 11, 22) }
        { Name = "0.18"; Start = DateTime(2016, 05, 06); End = DateTime(2016, 05, 22) }
        { Name = "0.19"; Start = DateTime(2016, 11, 04); End = DateTime(2016, 11, 20) }
        { Name = "0.20"; Start = DateTime(2017, 05, 26); End = DateTime(2017, 06, 11) }
     ]

let allRequests =
     allTournaments
     |> List.collect (fun tournament ->
         dataSet.Columns.Keys |> Seq.map (fun columnName ->
             nexosis.SessionsCreateImpactSession(
                 "DCSS",
                 columnName,
                 tournament.Name,
                 "Day",
                 tournament.Start.ToString("o"),
                 tournament.End.ToString("o"),
                 null, None, null)
         ) |> Seq.toList
     )
Once all of these sessions complete, we can easily download all of the results.
let downloadResults() =
     allRequestSessionIds |> List.map nexosis.SessionsRetrieveResults
If we look at the pValues across the impact sessions, we can see that there are generally very low pValue scores. This means that the tournaments have a high correlation in the measured values changing from their normal levels.
let allResults = downloadResults()
allResults |>
    List.map (fun r -> (r.ExtraParameters.["event"], r.TargetColumn, r.Metrics.["pValue"]))
    |> Frame.ofValues
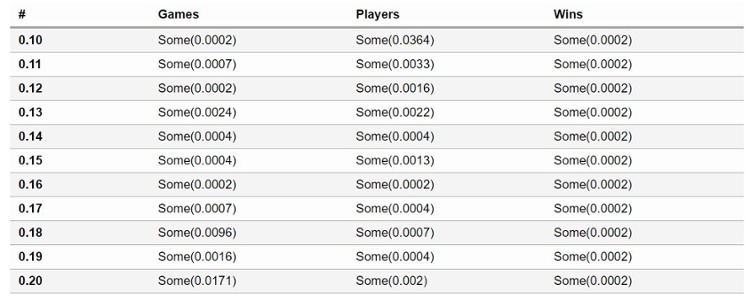
We can also take a look at a few of the more interesting numbers.
 let getRelativeEffects columnName =
     allResults
         |> List.filter (fun r -> r.TargetColumn = columnName)
         |> List.map (fun r -> (r.ExtraParameters.["event"], r.Metrics.["relativeEffect"].Value * 100.0))

 [
     getRelativeEffects "Games"
     getRelativeEffects "Players"
     getRelativeEffects "Wins"
]
    |> Chart.Line
    |> Chart.WithOptions relativeOptions
    |> Chart.WithLabels ["Games"; "Players"; "Wins"]

If we look at the relative impact percentage of all the tournaments, we can see a big spike in the 0.16 tournament. So, if you are rating tournaments on how many games and players a tournament attracts over normal game traffic, the 0.16 tournament is the clear winner. But, this may be explained by the fact that there was a bug in the 0.16 version of the game which doubled player melee damage. This did cause an increase in the rate of wins, both during the tournament, and for a short period beforehand.
Another thing to notice is that the relative effect of wins are much higher than the players or games that are played during a tournament. So, clearly, all of the players participating in the tournament are really playing to win. Possibly using safer strategies, and trying to create winning streaks.
let getAbsoluteEffects columnName =
    allResults
        |> List.filter (fun r -> r.TargetColumn = columnName)
        |> List.map (fun r -> (r.ExtraParameters.["event"], r.Metrics.["absoluteEffect"].Value))

getAbsoluteEffects "Games"
    |> Chart.Line
    |> Chart.WithOptions (absoluteOptions "Games")

getAbsoluteEffects "Players"
    |> Chart.Line
    |> Chart.WithOptions (absoluteOptions "Players")
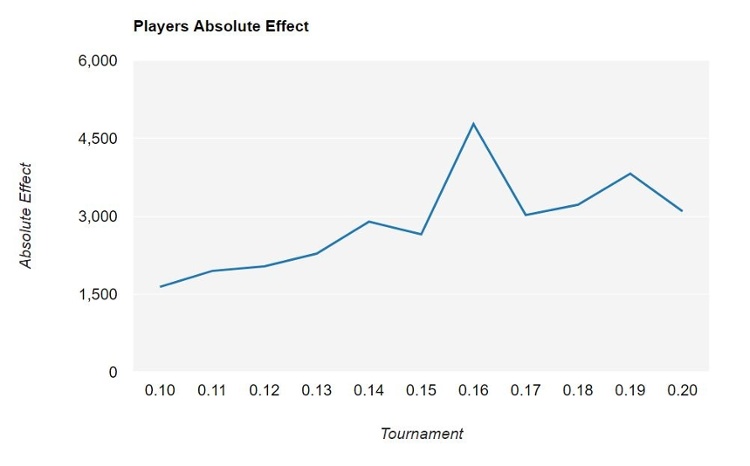
The number of players joining the tournaments seems fairly consistent, aside from the 0.16 tournament. The most recent tournament also seems to have attracted fewer players than in past years.
getAbsoluteEffects "Wins"
    |> Chart.Line
    |> Chart.WithOptions (absoluteOptions "Wins")
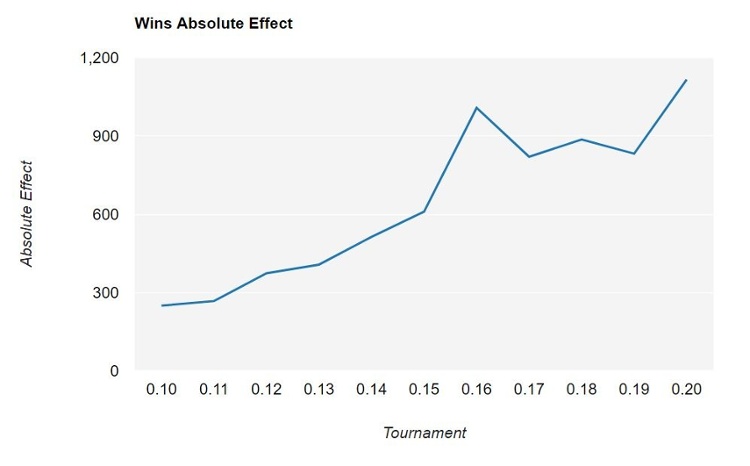
The absolute effect on the number of wins is increasing each tournament. Since the relative effect of wins it varying somewhat with each tournament, this appears to be a reflection that there are more and more games won on non tournament days.
[
    observedWins |> Series.observations
    allResults
        |> List.filter (fun r -> r.TargetColumn = "Wins")
        |> Seq.collect (fun r -> r.Data |> List.ofArray |> List.map (fun d -> (DateTime.Parse(d.["timestamp"]), (float d.["Wins"] ))))
]   |> Chart.Line
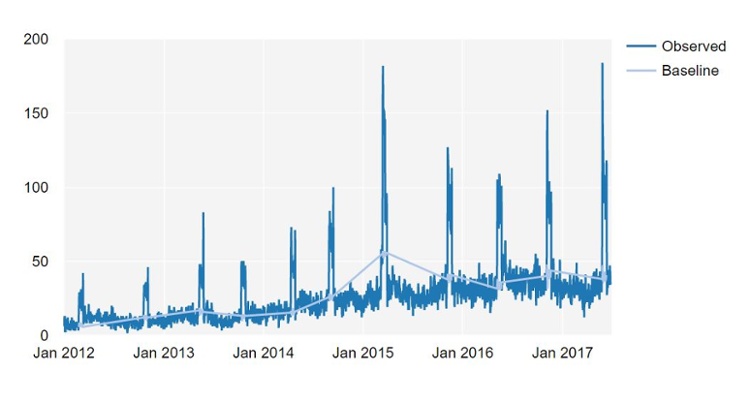
    |> Chart.WithLabels [ "Observed"; "Baseline" ]
